haiyen0903
Aug 3, 2022
Writing Feedback / The usage of electrical devices and the number of hours used for housework per household; IELTS 1 [2]
Task 1, Ielts writing, line chart
The charts below show the changes in ownership of electrical appliances and amount of time spent doing housework in households in one country between 1920 and 2019.
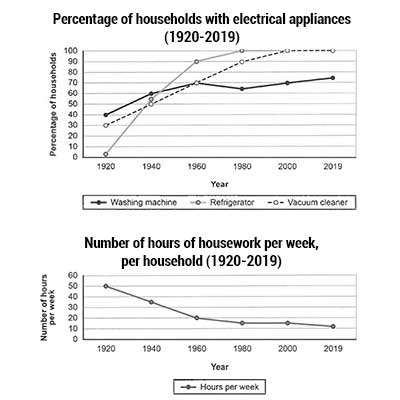
The charts given illustrate the usage of electrical devices and the number of hours used for housework per household in one country over a period of 99 years.
Overall, the proportion of electrical appliances used rose over the period shown. The proportion of refrigerator and vacuum cleaners took the lead in 2019, with 100% households using both devices. At the same time, the number of time spent on housework showed a reversed trend.
In 1920, no household used refrigerators. By contrast, the proportion of people using washing machines and vacuum cleaners was much higher, with 40% and 30% respectively. Over a period of 99 years, the percentage of households with electrical devices climbed dramatically.
All the households in that country utilized the refrigerator and vacuum cleaner, nearly 70% of households used the washing machine.
Regarding the amount of time spent on housework, the trend was a fall. In 1920, people spent 50 hours per week on housework. The trend then showed a rapid decrease. In 2019, only 10 hours was employed for housework per week.
Task 1, Ielts writing, line chart
The changes in ownership of electrical appliances
The charts below show the changes in ownership of electrical appliances and amount of time spent doing housework in households in one country between 1920 and 2019.
The charts given illustrate the usage of electrical devices and the number of hours used for housework per household in one country over a period of 99 years.
Overall, the proportion of electrical appliances used rose over the period shown. The proportion of refrigerator and vacuum cleaners took the lead in 2019, with 100% households using both devices. At the same time, the number of time spent on housework showed a reversed trend.
In 1920, no household used refrigerators. By contrast, the proportion of people using washing machines and vacuum cleaners was much higher, with 40% and 30% respectively. Over a period of 99 years, the percentage of households with electrical devices climbed dramatically.
All the households in that country utilized the refrigerator and vacuum cleaner, nearly 70% of households used the washing machine.
Regarding the amount of time spent on housework, the trend was a fall. In 1920, people spent 50 hours per week on housework. The trend then showed a rapid decrease. In 2019, only 10 hours was employed for housework per week.
The charts given illustrate the usage of electrical devices and the number of hours used for housework per household in one country over a period of 99 years.
Overall, the proportion of electrical appliances used rose over the period shown. The proportion of refrigerator and vacuum cleaners took the lead in 2019, with 100% households using both devices. At the same time, the number of time spent on housework showed a reversed trend.
In 1920, no household used refrigerators. By contrast, the proportion of people using washing machines and vacuum cleaners was much higher, with 40% and 30% respectively. Over a period of 99 years, the percentage of households with electrical devices climbed dramatically.
All the households in that country utilized the refrigerator and vacuum cleaner, nearly 70% of households used the washing machine.
Regarding the amount of time spent on housework, the trend was a fall. In 1920, people spent 50 hours per week on housework. The trend then showed a rapid decrease. In 2019, only 10 hours was employed for housework per week.

thechartsbelowsho.jpg
