pigchienn
Feb 22, 2023
Writing Feedback / WRITING TASK 1: The graph below shows consumers' average annual expenditure on cell phone, national [2]
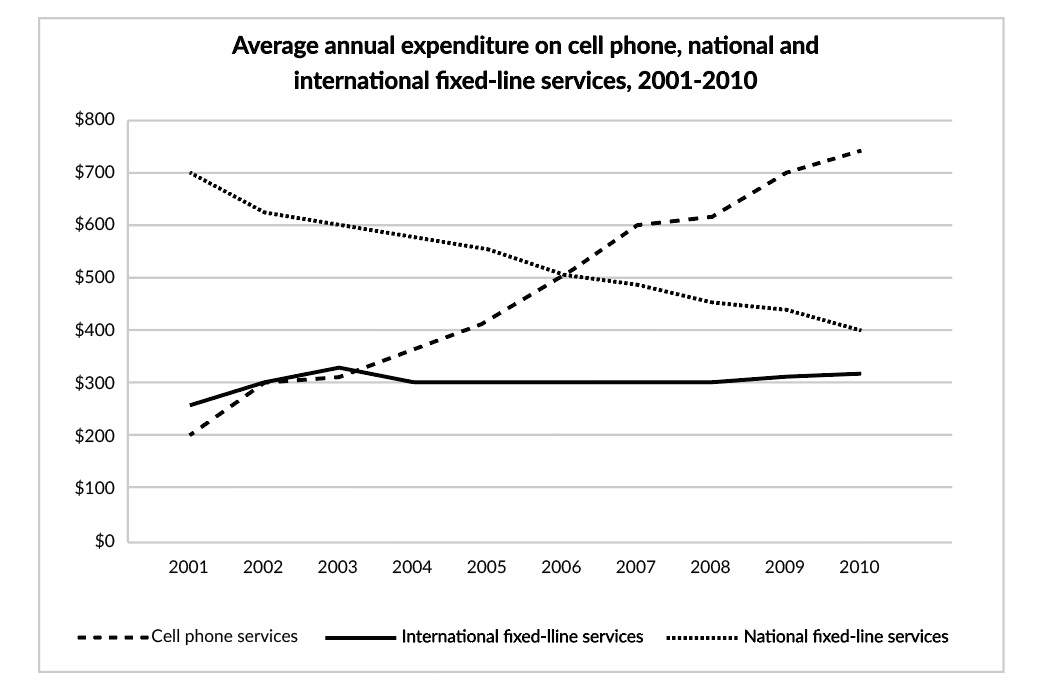
The presented line graph gives data about how much average money do American consumers spend yearly on cell phone services,national and international fixed-line services throughout a 9-year period commencing from 2001.
As can be seen from the chart, the average amount of cell phone services experienced a dramatic increase, while that in national fixed-line services went down swiftly during the period. The figure for international fixed-line services was lowest among three categories.
Starting off 2001, the US consumers paid nearly $700 yearly for national land line, compared to just under $250 for both worldwide and mobile phone landline services. Over the proceeding five years, the average expense for national fixed-line services decreased to almost $500. In contrast, annual spending on cell-phone services climbed steadily by around $300. Meanwhile, the average amount for worldwide land line services hovered around $300.
In 2006, American consumers spent the same amount of money on mobile and national fixed-line services, with just about $500 for each other. Since 2006, the amount of money spent on mobile phone services has surpassed that of national fixed-line services and gained popularity in the USA, at roughly $750 in 2010. Over the same period, the figure for international landline services still remained stable at approximately $300.
phone and fixed-line services expenditures
The presented line graph gives data about how much average money do American consumers spend yearly on cell phone services,national and international fixed-line services throughout a 9-year period commencing from 2001.
As can be seen from the chart, the average amount of cell phone services experienced a dramatic increase, while that in national fixed-line services went down swiftly during the period. The figure for international fixed-line services was lowest among three categories.
Starting off 2001, the US consumers paid nearly $700 yearly for national land line, compared to just under $250 for both worldwide and mobile phone landline services. Over the proceeding five years, the average expense for national fixed-line services decreased to almost $500. In contrast, annual spending on cell-phone services climbed steadily by around $300. Meanwhile, the average amount for worldwide land line services hovered around $300.
In 2006, American consumers spent the same amount of money on mobile and national fixed-line services, with just about $500 for each other. Since 2006, the amount of money spent on mobile phone services has surpassed that of national fixed-line services and gained popularity in the USA, at roughly $750 in 2010. Over the same period, the figure for international landline services still remained stable at approximately $300.

linegraphbieudod.jpg
