cchauaim8
May 5, 2023
Writing Feedback / IELTS Writing Task 1 about how the population component in Australia varies through a period of 15 y [2]
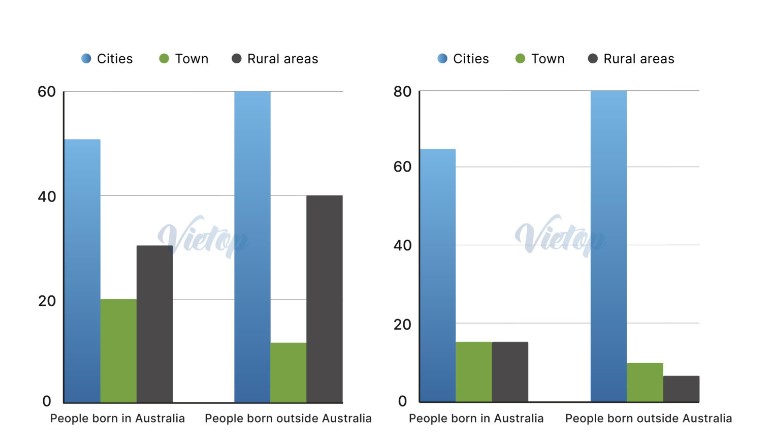
The illustrated bar charts delineate how the population component in Australia varies through a period of 15 years, categorized by administrative areas.
As clearly described, the total number of residents experienced a climb from 1995 to 2010 when the largest percentage rose from 60% to 80%. However, a noticeable feature that remained stable was that the non-native Australian rate was much higher than the native ones.
In addition, there was a contrasting trend in the population distribution. In particular, citizens from both aspects (who were born inside and outside Australia) favored living in cities more than ever. The number of non-native people increased by half. On the contrary, the proportion of residents who chose suburban regions as places to live declined substantially. Specifically, this group of people only accounted for under one-fifth of the total population in the latter period. For the ones who were not born in Australia and lived in the countryside, the proportion was reduced four times, from exactly 40% to below 10%.
the percentage of people who were born inside and outside Australia
The illustrated bar charts delineate how the population component in Australia varies through a period of 15 years, categorized by administrative areas.
As clearly described, the total number of residents experienced a climb from 1995 to 2010 when the largest percentage rose from 60% to 80%. However, a noticeable feature that remained stable was that the non-native Australian rate was much higher than the native ones.
In addition, there was a contrasting trend in the population distribution. In particular, citizens from both aspects (who were born inside and outside Australia) favored living in cities more than ever. The number of non-native people increased by half. On the contrary, the proportion of residents who chose suburban regions as places to live declined substantially. Specifically, this group of people only accounted for under one-fifth of the total population in the latter period. For the ones who were not born in Australia and lived in the countryside, the proportion was reduced four times, from exactly 40% to below 10%.

Screenshot2023050.jpg
