Lily Eilish
Aug 18, 2023
Writing Feedback / IELTS task 1 (The line graph reveals information on the waste output of three selected businesses) [2]
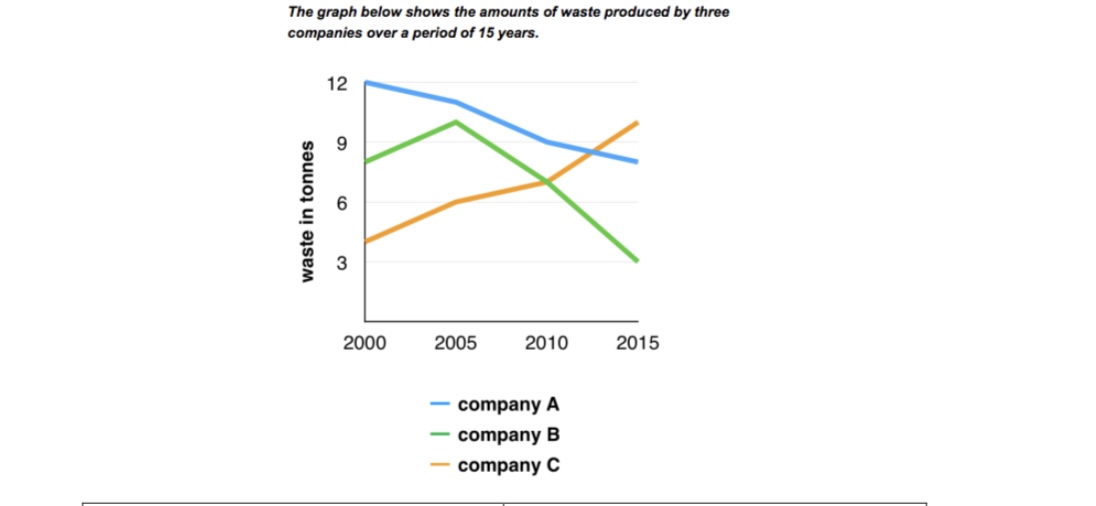
The line graph reveals information on the waste output of three selected businesses during the 15 year 2000-2015. Each unit is measured in tonnes.
From an overall perspective, while there was a significant decrease in the figure for company A and company B between 2000 and 2015, the reverse was witnessed for that of company C at the same time. By the year 2000, the figure for company A appeared to be by far the largest one, with roughly 12 tonnes, followed by the corresponding figure for company B, with approximately 8 tonnes. Nevertheless, the amount of waste produced by company C was found to be the lowest one, with about 4 tonnes by the starting year 2000.
Surprisingly, Company C found a growth in waste production of approximately 6 tonnes across the year 2000-2015. Conversely, the waste output of company A fell substantially to around 8 tonnes within 15 years, a huge decline of 1.5 times. In terms of the remaining category, company B, it displayed an increase of 2 tonnes by 2005, then declined considerably by the final year 2015, from nearly 10 tonnes to 3 tonnes.
The amount of waste produced by three companies over a period of 15 years
The line graph reveals information on the waste output of three selected businesses during the 15 year 2000-2015. Each unit is measured in tonnes.
From an overall perspective, while there was a significant decrease in the figure for company A and company B between 2000 and 2015, the reverse was witnessed for that of company C at the same time. By the year 2000, the figure for company A appeared to be by far the largest one, with roughly 12 tonnes, followed by the corresponding figure for company B, with approximately 8 tonnes. Nevertheless, the amount of waste produced by company C was found to be the lowest one, with about 4 tonnes by the starting year 2000.
Surprisingly, Company C found a growth in waste production of approximately 6 tonnes across the year 2000-2015. Conversely, the waste output of company A fell substantially to around 8 tonnes within 15 years, a huge decline of 1.5 times. In terms of the remaining category, company B, it displayed an increase of 2 tonnes by 2005, then declined considerably by the final year 2015, from nearly 10 tonnes to 3 tonnes.

61EF1B1941C94B38A.jpeg
