phuthinh
Jul 31, 2024
Writing Feedback / TASK 1: the number of people who don't have occupation [2]
This is my first time writting Task 1 so I hope everyone can give me some feedbacks so that I can improve my writting skills.
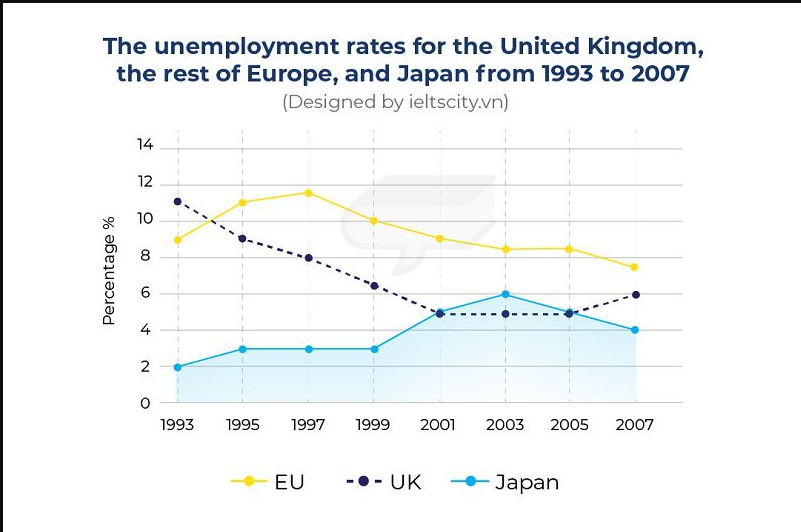
The line graph demonstrates the number of people who don't have occupation in three different destinations including the EU, UK and Japan from 1993 to 2007. Overall, it can be seen from the graph that the number of unemployed people dramatically changed during the study time.
In 1993, 11% of people living in the United Kingdom weren't employed and that number reduced significantly within 6 years from 9% in 1995 to 5% in 2001; however, the number of unemployed people remained stable from 2001 to 2005, accounting for 5% before continuously rising to 6% in 2007.
The number of people losing their occupation in the rest of Europe was 9% and reached its peak in 1997, consisting of approximately 11.8% before gradually dropping to 8.2% in 2003. Furthermore, that number remained constant a year later at 8.2% and slightly reduced in 2007.
While Japan was the country whose unemployment rate in 1993 took the least, occupying 2% and rising to 3% within a year. Throughout the next four years since 1995, the number of people who lost their job remained unchanged when stabilizing at 3% before reaching a high of 6% in 2003. Nevertheless, the number of unemployed people showed a downward tendency when dropping from 6% to 45 in 2007.

Capture.PNG
