sandy21709
Jan 31, 2024
Writing Feedback / [IELTS WRITING TASK 1] Percentage of households [4]
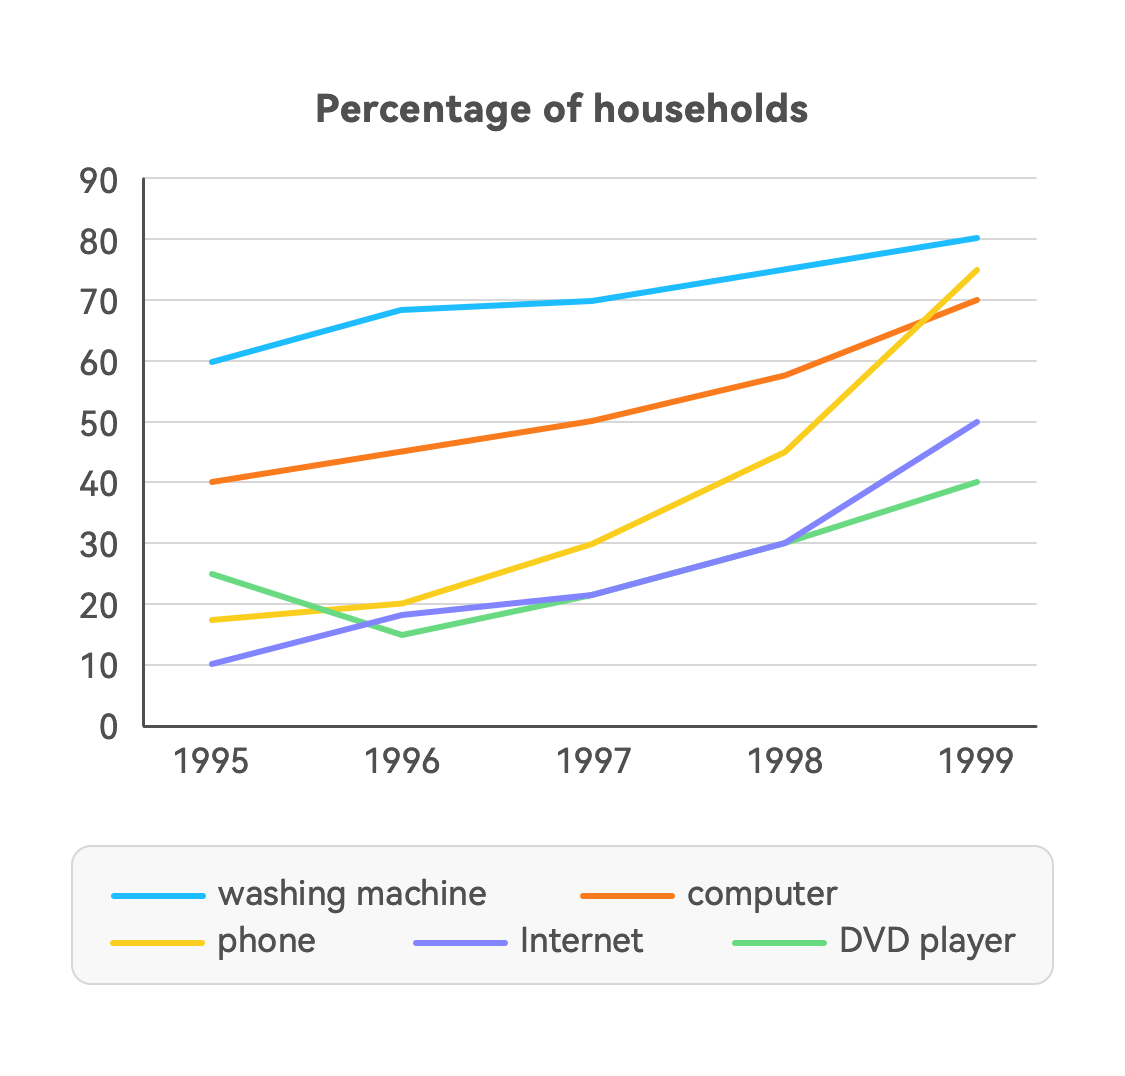
This line graph shows the changing trends in the number of house items between 1995 and 1999. Overall, it is evident that all the numbers from five households increased over time.
At the start of the period, while washing machines dominated and reached almost 60 percent of house items, the other items had less than half. However, washing machines maintain their growth slightly, followed gradually by phones and computers. Compared to 1995 and 1999, the gap between washing machines and other items is getting smaller.
DVD players were leading behind the Internet in 1995 when DVD players decreased sharply until 1996 when the Internet increased and overtook DVD players. Both of their growths tended towards stability until 1998. The Internet exceeded DVD players and reached 40 percent, while the latter remained at 10 percent in 1999.
Nevertheless, the most significant change was seen in numbers coming from computers. Though it started in the fourth place, it increased dramatically over the years. The number of phones took the place of computers, which usually was in second place before 1998, reaching approximately 65 percent in 1999.

93A6E5335DAB44BEA.png
