HZQ
Mar 11, 2024
Writing Feedback / IELTS Task 1: The graph below shows of types of waste that were recycled in a town between 2000-2010 [3]
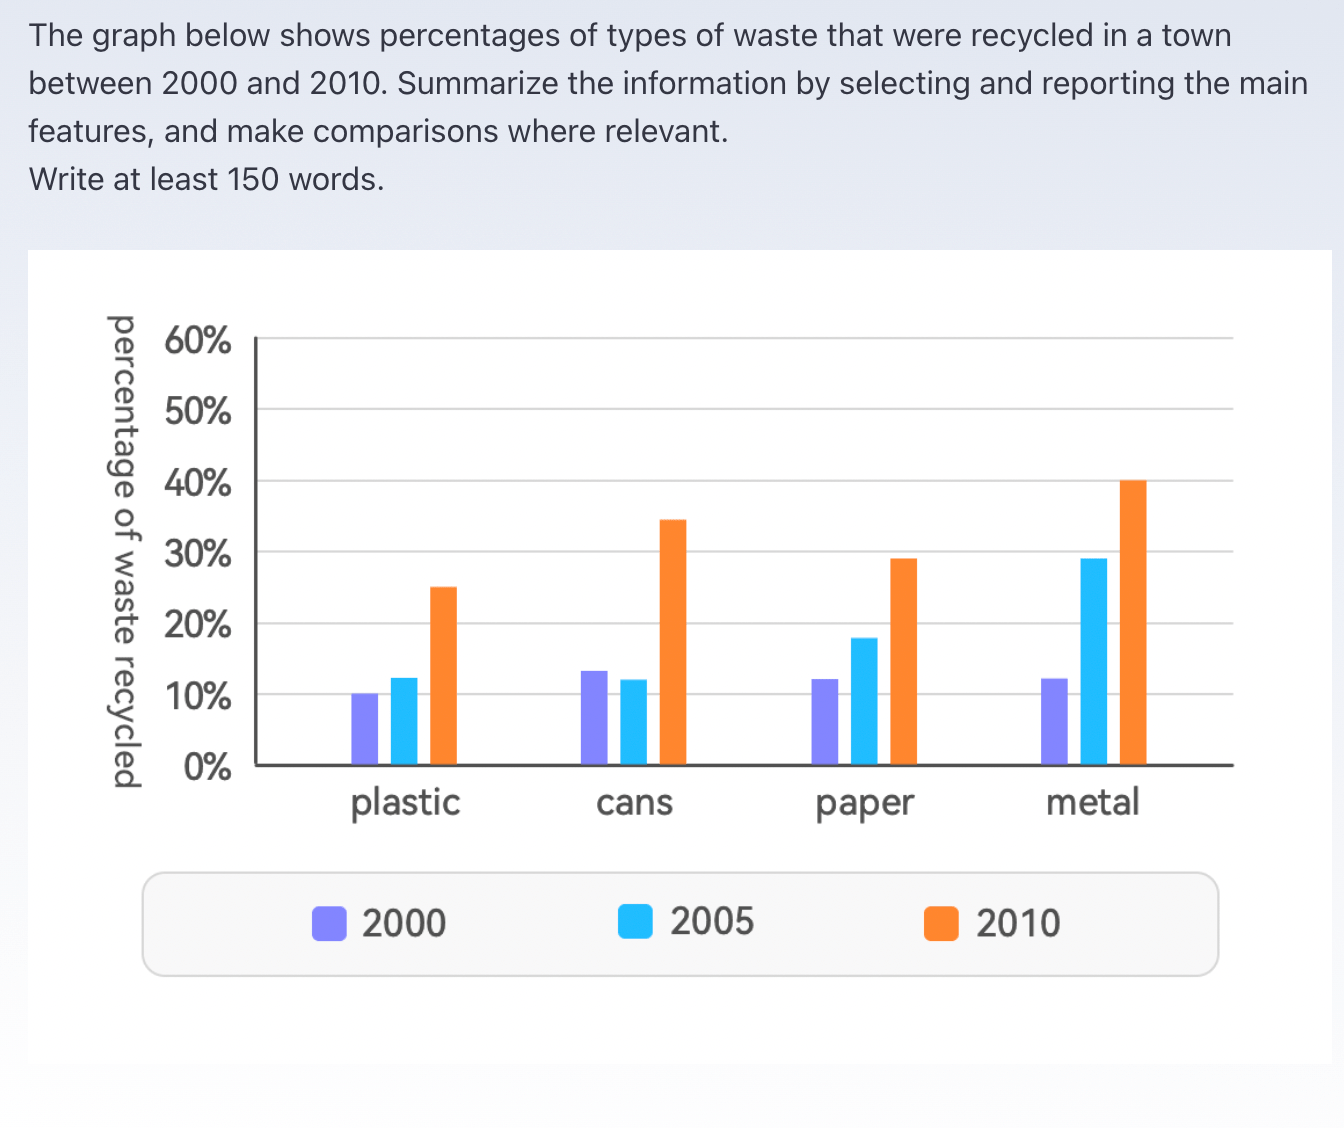
The bar chart demonstrates the proportions of 4 different recyclable wastes in a town, which are plastic, cans, paper, and metal, over a period of 10 years.
The amount of recycled waste enhances a lot from 2000 to 2010. The recycled percentages of most categories steadily increase except "cans," which slightly fell in 2005. In addition, the rise of the sort of metal is noticeable, which continuously increases and occupies the highest position of the recyclable objects in 2010.
The efficiency of recycling in 2010 is far better than in 2000, whose recycled percentages are merely around 10%; while 10 years later, the recycling degree has improved 3.5 times to 4 times.
In 2005, the recycled amount of metal appears a relatively apparent change. The percentage of recycled metal is approximately 30% while the other categories are merely half of this rate. Along with the time past, metal in the end climb to the first position of all the recyclable waste, and its rate is 40%.

20240311.png
