dller
Nov 11, 2024
Writing Feedback / Writing task 1: The chart below shows the percentage of different types of household waste [2]
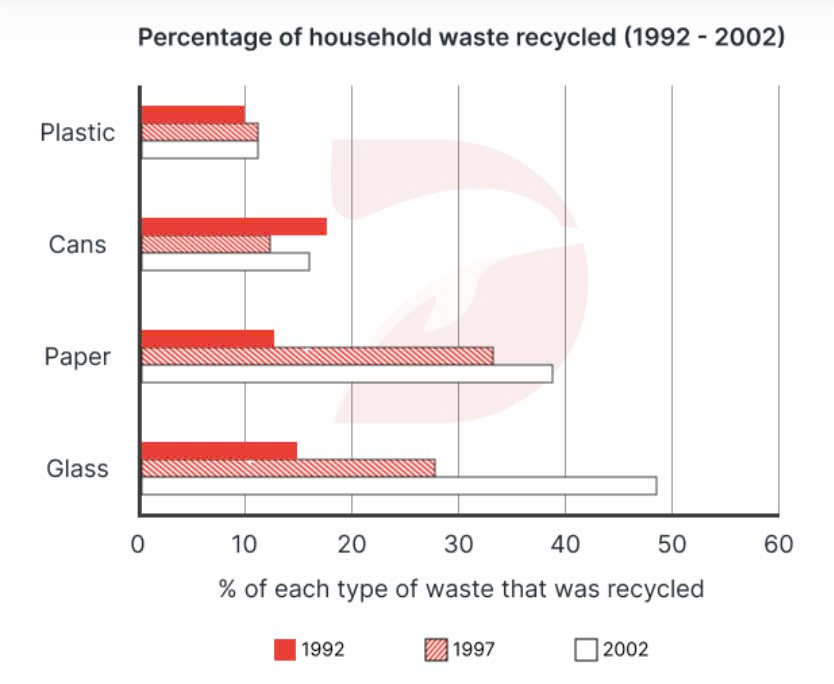
The bar chart illustrates the proportion of four different kinds of household waste recycled in a particular city from 1992 to 2002.
Overall, while the percentage of recycled paper, glass and plastic saw significant increases, that of cans declined slightly over the period. It is noticeable that the figure for recycled plastic was the smallest and it remained largely unchanged from 1997 to 2002.
Looking at paper and glass that were recycled more compared to 2 remaining household waste, both of them starting at nearly 15% in the first year, followed by dramatic growth, with more than 30% for the former and 28% for the latter in 1997. Then, by 2002, the figure for paper increased slightly to approximately 40%, and this was seen as the highest figure in this year, while this trend was also observed in that for recycled glass, rising by around 20% in the last period.
Turning to plastic and cans which were recycled less in the period, there was a decrease in the percentage of the latter, from 17% to more than 10% in 1997, and then followed by a small increase to 15% in the last period. In contrast, after growing slightly to 12% in 1997, the figure for plastic that was recycled remained unchanged throughout the last 5 years in the period.

unnamed.png
