williamcosta
Oct 13, 2012
Writing Feedback / IELTS TASK 1: GRaph/ consumption of fish and some different kinds of meat [2]
Please provide critical feedback grammar, content all things
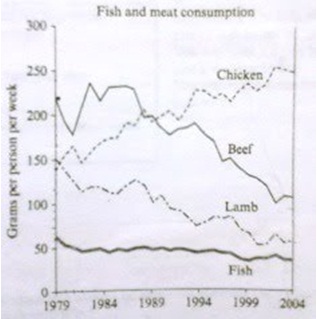
Question 1:The graph below shows the consumption of fish and some different kinds of meat in a European country between 1979 and 2004. Summarize the information by selecting and reporting the main features, and make comparison where relevant.
Answer:
The line graph illustrates the consumption of fish and several types of meat in grams per capita per week in a European country over the period of 25 years from 1979 to 2004.
As can be seen, beef was the most popular kind of dish in initial years, whereas fish was the least popular dish. But, in subsequent years chicken became more common than any other kind of dish.
Overall, there was a gradual decrease in the number of grams of fish consumed by each person. In 1979, every person ate around 60 grams of fish, and this number fell to about 50 grams per capita by 2004. In comparison, there was a considerable reduction in the intake of lamb's meat over the given period. Starting at 50 grams per person, people consumed less and less amount of this type of meat as the years went by and amount showed a downward trend. The consumption of lamb's meat reached its peak at around 60 grams each person each week.
In contrast, the figures for chicken consumption rose steadily with an upward trend and peaked at 250 grams of intake per person on weekly basis. On the other hand, the figures for consumption of beef dropped sharply after initial fluctuations. In 1979, every person consumed 220 grams whereas by 2004, this number fell to approximately 125 grams per person per week.
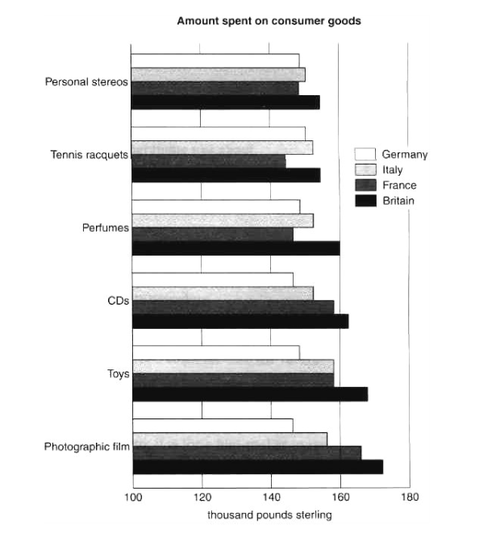
Question 2: See the graph in picture 2 and explaing
Answer:
The bar chart shows the amount of money spent on consumer goods in five different countries of Europe.
As can be seen, Britain spent more money on all types of goods compared to the other three countries. Of the six items, consumers spent the most money on photographic film.
British people spent about 170 pounds sterling on photographic film. France was the second largest spender on three items namely photographic film, toys and CDs, while spending large part of its money on photographic film, around 165 pounds. French people spent lowest sum of money on remaining three items than any other country.
On the other hand, Italians spend significantly more money on toys than any other item, with spendings of just under 160 pounds, which was equal to France's. In contrast, Germany spent least amount on consumer goods. It had similar figures for all six items varying between 145 and 150 pounds.

Graph for QUestion 1
Graph for QUestion 2
