dannydo
Apr 13, 2013
Writing Feedback / IELTS Writing Task 1 - Bar chart (various flavours of food) [4]
Hi all,
I am new to this forum. I would like to have your comment on the IELTS writing task 1. Please help. Thank you very much.
--------------------------------------------------
Task 1
You should spend about 20 minutes on this task
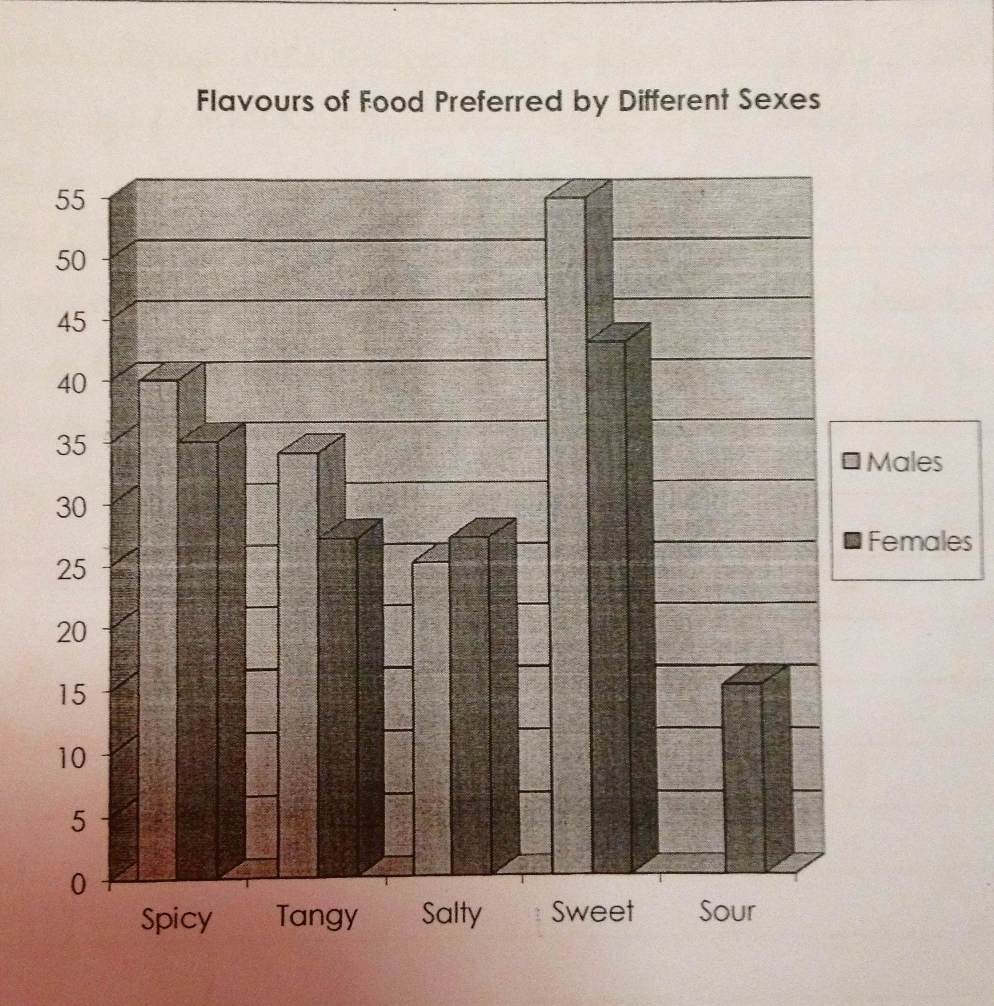
The graph below shows the various flavours of food preferred by different sexes in a month
Summarise the information by selecting and reporting the main features, and make comparisons where relavant.
Answer:
The graph illustrates the difference in the choices of food tastes between males and females in a month.
As can be see from the data, both of sexes are very fond of sweet food. Data reveals that 55 males prefer eating sweet food, while 43 females choose this kind of flavour. However, the number of males who like spicy, tangy and salty food decreases gradually from 40 people to 25 people. It is noticeable that no male chooses sour food which is chosen by 15 females as their favourite flavour.
The trend happens quite similarly to woman, there is a slight drop in the number of females who like spicy and tangy about 10 people. Although the number of woman who like tangy and salty food is the same, there is a significant decline in sour food, only 15 people like it.
In conclusion, it is clear that there are different choices between two sexes in their favourite food tastes. Obviously, spicy, tangy and salty food are more popular in males than females, whereas sour food is chosen by only females.

bar chart
