rushil1995
May 19, 2013
Writing Feedback / IELTS Task1; percentage of total US population aged 65 and over between 1900 and 2000 [3]
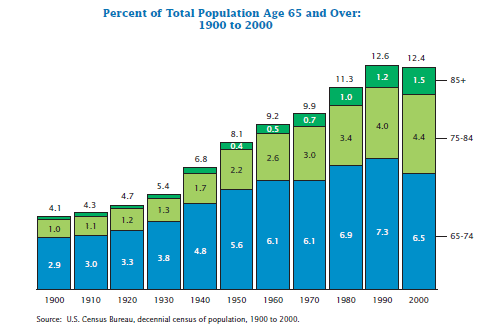
The graph represents the percentage of people aged 65 and above in the US between the years 1900 and 2000.
It can be seen that the total percentage of aged people has been increasing through out the years until 1990. After 1990 there was a slight drop in the percentage of aged people. It started off with 4.1% in 1900 to 12.6% in 1990 and a fall to 12.4%in 2000.
For more convenience and better representation the graph has been divided into age groups of 65-74 years, 75-84 years and 85+. It is clear from the graph that the percentage of people in the age group 65-74 kept increasing till the year 1960. It kept constant till 1970 at 6.1% and again increased till 1990. After 1990 the percentage fell from 7.3% to 6.5%.
A growth rate has been witnessed in the age group 75-84 as well. From the year 1900 till 2000, we see that there is a continuous rise from 1% to 4.4% percentage of the total population.
The growth rate in the age group 85+ has not been very wide. In the year 1900 this age group was 0.2% of the entire population. This percentage increased but was not very much. By the year 2000, this age group just managed to touch 1.5% of the entire population.
This shows that as countries become rich and developed the percentage of aged people increase as there is better medical assistance and standard of living.

Chart of the question
