vandon92
Sep 15, 2014
Writing Feedback / IELTS Writting task 1: UK adolescents following a vegetarian diet. [7]
Please help me check this. Thank you very much!
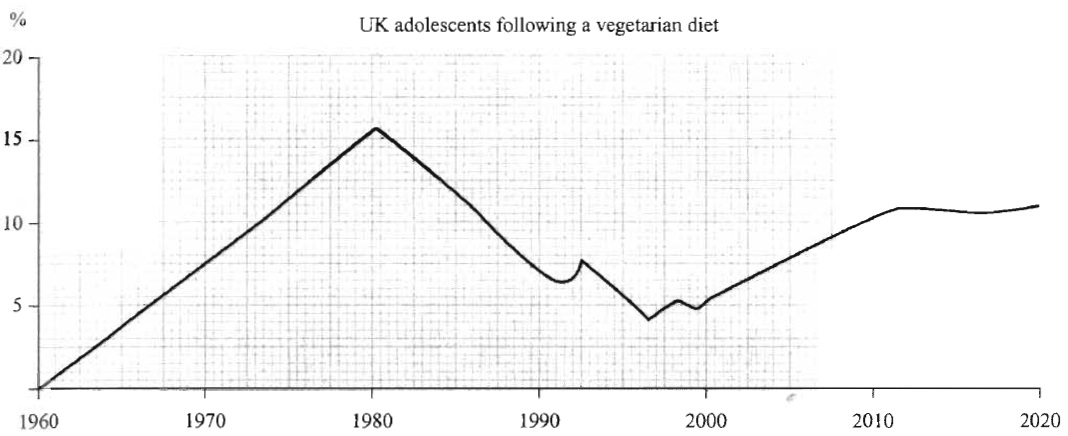
The graph shows the percentage of UK adolescants following a vegetarian diet. Summarise the information by selecting and reporting the main features.
The graph illustrates the proportion of young peoples in UK taking part in a vegetarian diet, from 1960 to 2020. Overall, it can be seen that figure fluctuated over the period, but the trend was still upward. Started at 0% in 1960, the percentage accerelated and reached its highest level of slightly more than 15% in 1980, and this was also the highest peak over the period. Afterward, there was a significant drop in the percentage of UK vegetarian juvenile, from over 15% to nearly 7%. The figure then moved up and down wildly before recovered gradually by around 10% in 2012. Subsequently, the percentage was fairly stable at 12% in 2020.

165873_1_o.jpg
