cl50803
Apr 4, 2016
Writing Feedback / CHARTS the age and gender of single-occupant households as well as how many bedrooms in their houses [2]
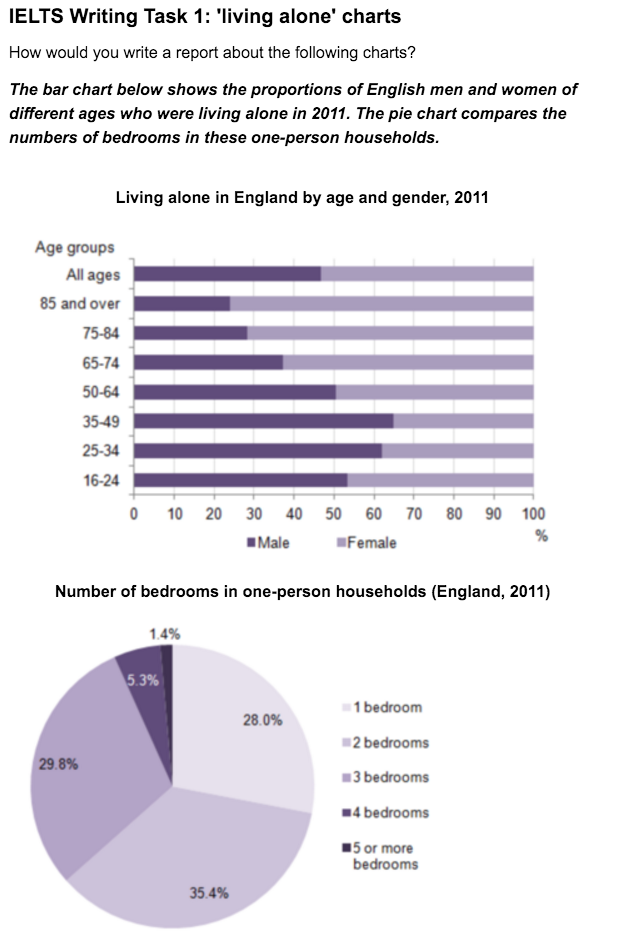
These two charts shows the age and gender of single-occupant households as well as how many bedrooms in their houses in England in the year 2011.
Overall, we can notice that females living alone were slightly more than males averagely according to the bar chart. Meanwhile, the pie chart indicates that most single-occupant households would not have more than three bedrooms in their homes.
If we look at the bar chart closely, it is obvious that there were more males than females in terms of living alone within the age of 16 to 49, whereas after the age 50, more and more females made up the proportion of single-occupant households and eventually surpassed males from the age of 65 to 85 and over.
The pie chart not only demonstrates the most common number of bedrooms in a one-person home was 2, but also reveals the fact that only about 1.4% of them were equipped with 5 bedrooms.

_20160404_5..png
