Rin El_Faariha
Jan 15, 2017
Writing Feedback / Compare the data on a global scale - report [3]
Information about global population percentages and distribution of wealth by region.
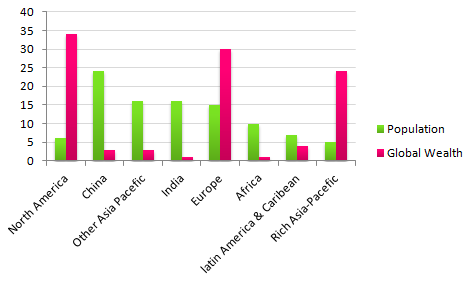
The bar graph highlights a population and Global wealth in 8 countries and is measured by percent. Overall, it is immensely clear that the Global wealth describes highest quantity in North America, while India has lowest quantity.
A closer look at, North America explains tallest proportion at Global wealth approximately 30,3%, whereas Global wealth is the lowest around by 2% in India. The second tallest is followed by Europe at 30%. Finally, it is occurred by Rich Asia-Pacefic about 23%. Thereafter, China and other Asia Pacefic show similar proportion at approximately 3%, it is slightly lower by Latin America and Caribean about 4%. At the end, India and Africa illustrate similar level approximately 1%.
On the other hand, China shows largest level at population about 24%, thereafter, other Asia Pacefic and India displaye alike level about 16% whilst Europe is different proportion by 1%. Africa and Latin America and Caribean are quite dissimilar by 2%. At the end, it is followed between North America and Rich Asia Pacefic that are slightly lower by 1% at population.
Information about global population percentages and distribution of wealth by region.
population and Global wealth
The bar graph highlights a population and Global wealth in 8 countries and is measured by percent. Overall, it is immensely clear that the Global wealth describes highest quantity in North America, while India has lowest quantity.
A closer look at, North America explains tallest proportion at Global wealth approximately 30,3%, whereas Global wealth is the lowest around by 2% in India. The second tallest is followed by Europe at 30%. Finally, it is occurred by Rich Asia-Pacefic about 23%. Thereafter, China and other Asia Pacefic show similar proportion at approximately 3%, it is slightly lower by Latin America and Caribean about 4%. At the end, India and Africa illustrate similar level approximately 1%.
On the other hand, China shows largest level at population about 24%, thereafter, other Asia Pacefic and India displaye alike level about 16% whilst Europe is different proportion by 1%. Africa and Latin America and Caribean are quite dissimilar by 2%. At the end, it is followed between North America and Rich Asia Pacefic that are slightly lower by 1% at population.

IELTS_Writing_Task_1.png
