ellisana
Jan 21, 2017
Writing Feedback / IELTS Task 1: How Do U.S. Expenditures Compare With Those Of Other Countries? [4]
IELTS Task 1: Shares of expenditures for selected categories in 4 countries, 2009
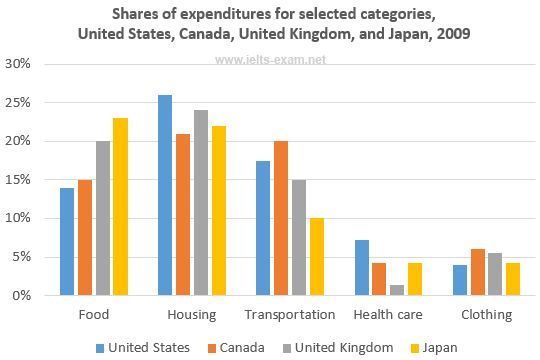
The bar chart gives information for 4 countries (United States, Canada, United Kingdom and Japan) regarding the shares of expenditures on five categories such as food, housing, transportation, health care and clothing in 2009.
It is noticeable that housing expenditure share was the highest cost of categories which United States spent the larger of housing than other countries, at 26%. UK, Japan, and Canada followed on 24%, 22% and 21%. Next, food and transportation categories were in most quite similar. Japan had 23% on food category and it was the biggest proportion than food expenditure rate in other countries between 14% and 20%. In other hand, Briton spend smaller cost of transportation sector than Canadian, American and Japanese, about one in ten.
Standing in contrast, the percentage of health care and clothing was extremely lower than other categories, just around one in twenty. Briton spent approximately 1% on health care sector and it was the lowest proportion in data shown.
IELTS Task 1: Shares of expenditures for selected categories in 4 countries, 2009
four countries expenditures
The bar chart gives information for 4 countries (United States, Canada, United Kingdom and Japan) regarding the shares of expenditures on five categories such as food, housing, transportation, health care and clothing in 2009.
It is noticeable that housing expenditure share was the highest cost of categories which United States spent the larger of housing than other countries, at 26%. UK, Japan, and Canada followed on 24%, 22% and 21%. Next, food and transportation categories were in most quite similar. Japan had 23% on food category and it was the biggest proportion than food expenditure rate in other countries between 14% and 20%. In other hand, Briton spend smaller cost of transportation sector than Canadian, American and Japanese, about one in ten.
Standing in contrast, the percentage of health care and clothing was extremely lower than other categories, just around one in twenty. Briton spent approximately 1% on health care sector and it was the lowest proportion in data shown.

Bar Chart
