Writing Feedback /
Task 2 IELTS The line graph illustrates amount of UK employee transporting every day [5]
Hi I am practicing on IELTS and I got this prompt:
The prompt says:
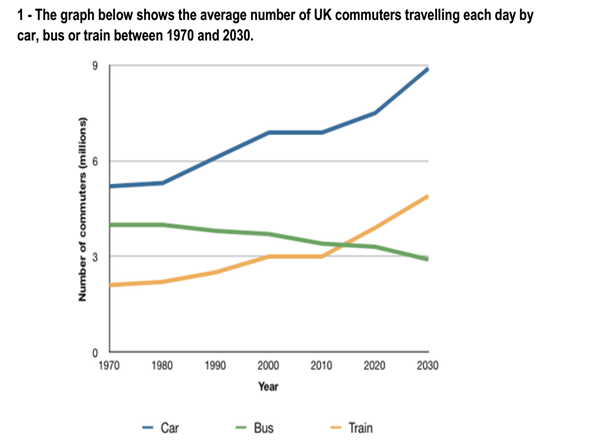
the graph below shows the average number of UK commuters traveling each day by car, bus, or train between 1970 and 2030.English people traveling on roads in UK
The line graph illustrates amount of UK employee transporting every day by three different vehicles such as a car, bus and train from 1970 to 2030.
It is clear that car is the most popular transportation over a period of 60 years. While the number of people who use car and train increase steadily, the number of bus users reduce dramatically.
In 1970, the proportion of people using the car in the UK was about 5,5billion. The figures for train and bus were lower, at about 2 and 4billion. In 2000, whereas the number of commuters who used car and train showed an upsurge, the bus went down a lot. In 2011, the number of workers who used the train as same as the bus user and get over the next years. However, the estimate of the car still stood in the first position.
By 2030, those people who are driving to work by car expected to reach 9 billion and the number of train user is around 5 billion. In contrast, buses are predicted to fall 3 million.

image.png

