masami
Apr 23, 2017
Writing Feedback / Ielts task 1: A line graph describing waste production of three companies [4]
Hi, as I am currently preparing for my imminent Ielts exam, your honest evaluation and score would be appreciated a lot. Thanks for you help in advance :)
Ielts writing task 1
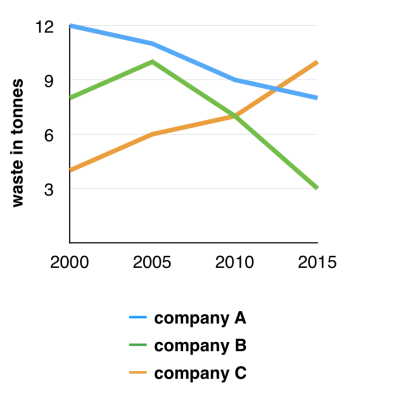
The graph below shows the amounts of waste produced by three companies over a period of 15 years.
The line graph above compares the waste production of three enterprises in the span of 15 years,from 2000 to 2015.
Overall, company A and B saw a decline in amounts of waste produced while company C experienced a steady rise between the year 2000 and 2015.
It is clearly shown in the graph that company A produced 12 tonnes of waste in 2000 and it cut the waste output to slightly below 9 tonnes in 2015. On the contrary, company C started off with 4 tonnes in waste production and then steadily increased to considerably above 9 in 2015.
As for company B, its waste production gradually rose from about 9 tonnes in 2000 to approximately 10 tonnes in 2005. Company B then witnessed a rapid fall in waste output to 3 tonnes in the year of 2015.
Words count:138 words
Hi, as I am currently preparing for my imminent Ielts exam, your honest evaluation and score would be appreciated a lot. Thanks for you help in advance :)
Ielts writing task 1
COMPANIES GARBAGE AND TRASH - IN TONNES
The graph below shows the amounts of waste produced by three companies over a period of 15 years.
The line graph above compares the waste production of three enterprises in the span of 15 years,from 2000 to 2015.
Overall, company A and B saw a decline in amounts of waste produced while company C experienced a steady rise between the year 2000 and 2015.
It is clearly shown in the graph that company A produced 12 tonnes of waste in 2000 and it cut the waste output to slightly below 9 tonnes in 2015. On the contrary, company C started off with 4 tonnes in waste production and then steadily increased to considerably above 9 in 2015.
As for company B, its waste production gradually rose from about 9 tonnes in 2000 to approximately 10 tonnes in 2005. Company B then witnessed a rapid fall in waste output to 3 tonnes in the year of 2015.
Words count:138 words

line_chart.png
