Writing Feedback /
The amount of time people spent by the phone in the UK [3]
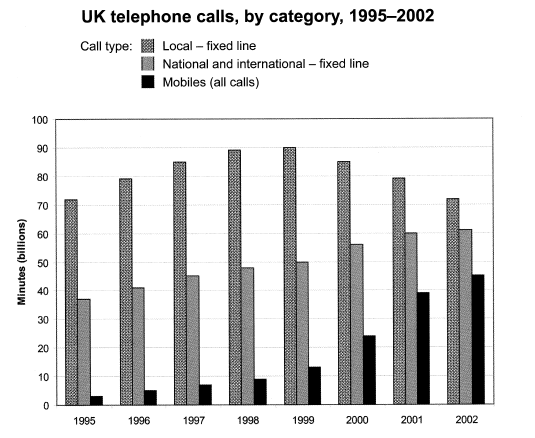
The chart below shows the total number of minutes (in billions) of telephone calls in the UK, divided into three categories, from 1995-2002.
Summarise the information by selecting and reporting the main features, and make comparison where relevant.phone calling statistics in britain
The bar chart compares three different types of UK telephone calls over a period of 7 years, measured in billions of minutes.
Overall, although the mobile calls were still the least popular in 2002, the gap between the three categories had extended considerably over the 7 - year period.
In 1995, mobile calls has the lowest using by the UK people, nearly 2,5 million minutes. In contrast, local-fixed line calls and national and international calls has the percentage of minute of about 72 million and 37 million, respectively. The period between 1995 and 2002 witnessed a slight increase in the proportion of minutes of local-fixed line calls, reaching 90 million in 1999.
The totals of national - international- fixed line calls relatively go up from 37 million minutes to 62 million minutes for local-fixed line fell sharply from their peak in 1999 to equalize with the figure of itself in 1995. However, the local - fixed line calls were the highest over the period shown.

cam_10_test_2_task_1.png

