Writing Feedback /
IELTS Task 1 - Learning difficulties faced by students from two schools (table) [3]
what kind of study problems in schools?
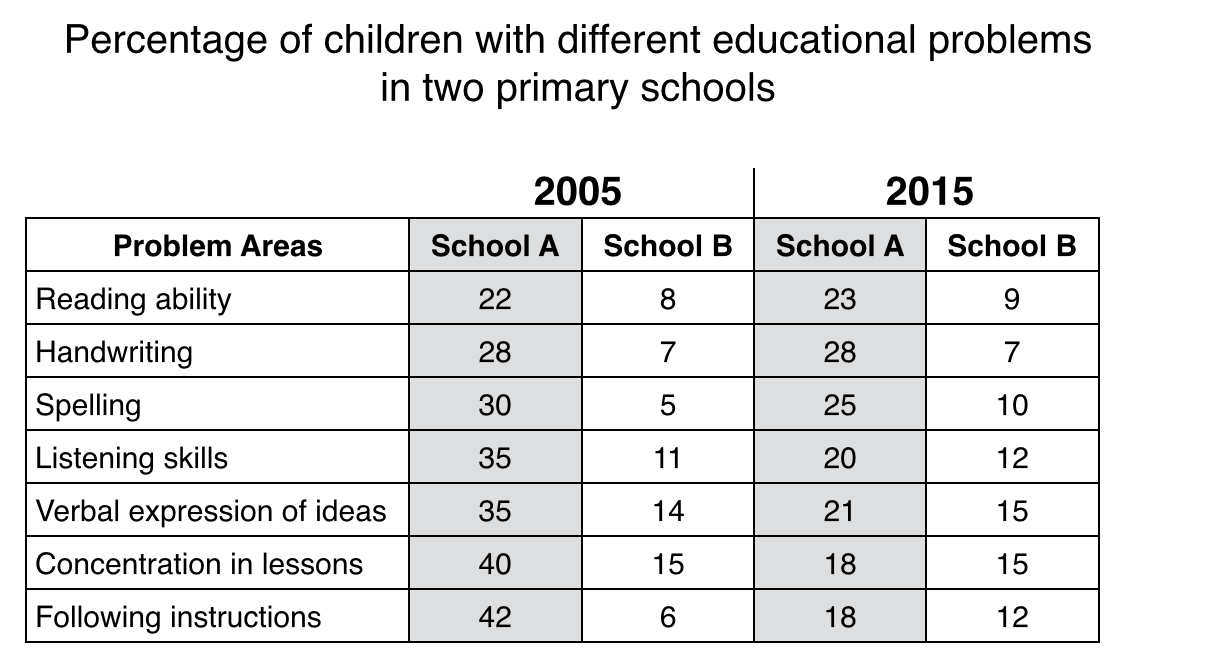
The table illustrates the seven areas of difficulties encountered by pupils in two primary schools in 2005 and 2015.
Overall, there were more students from school A facing the seven problems than from school B in both given years. While the most students from school A found it difficult to follow instructions in 2005, students from school B reflected concentrating in lessons as the major problem. Whereas in 2015, children in school A faced problems in having good handwriting, while not being able to keep concentrated in lessons was still the main problem for school B.
In 2005, 42% of students of school A had problem in following instructions, followed by 40% of them found difficulties in concentrating in classes. In contrast, the former problem involved the second least proportion of children in school B (only 6%), but the latter problem was also a main one, with 15% of students involved. The remaining problems was at range of around 20% to 35% and about 5% to 15% in school A and school B respectively.
In 2015, the figures of the seven problems for both schools were similar, except for the significant decrease in percentage for the two major problems in school A, both halved from over 40% to under 20%, and the slight climb for school B in terms of following instructions from 6% to 12%.
** It seems that I did not mention much data other than the items with the most and least percentage of students, does this matter?
** I found it confusing in how to group the data from table as there are really so many numbers, which when I deal with bar charts, will be less problematic. Thank you!

6a0120a5bb05d8970c01.png

