Writing Feedback /
TASK 1 - BAR GRAPH - ANNUAL RIDERSHIP; public transport in Williamsville [5]
This is my essay for the Ielts Writing task 1. I would be grateful if someone here sends me some comments!
TASK 1 - BAR GRAPH - ANNUAL RIDERSHIP
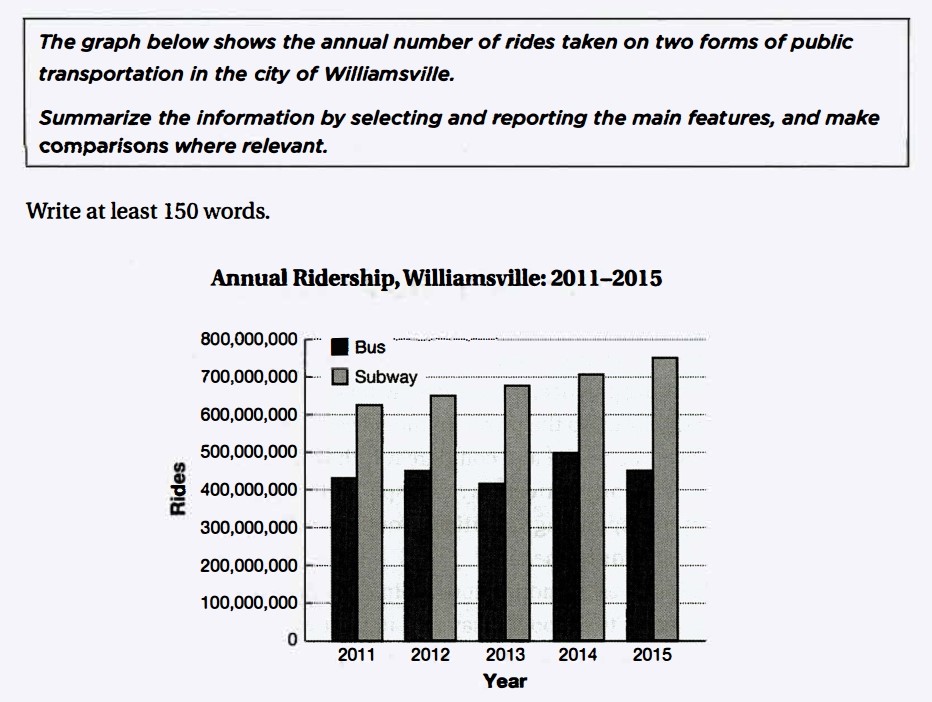
The bar graph shows how many passengers travelled by two means of public transports in the city of Williamsville yearly from 2011 to 2015. The numbers of rides are significant different between bus and subway throughout the 5-year period.
The number of bus annual riderships stayed nearly the same between 2011 and 2015. A little under 450 million rides taken on bus in 2011. Then, there was a modest growth from 2011 to 2012, when 450 million bus ridings were recorded in 2012. Another slight rise was discerned from the graph between 2013 and 2014, and 2014 saw the highest number of bus ridership.
Subway annual ridership, on the other hand, increased steadily over 5 years. 2011 was the year with the least rides taken by subway, with a little over 600 million rides, which was around one and a half times as much as the number of bus ridings in the same year. This number rose gradually until it reached the highest in 2015, with about 750 million rides by subway.
In general, the annual number of rides taken on bus did not vary too much between the 5-year period, and the number of subway riderships is much more than that of bus ridings.
(205 words)

cats.jpg

