duchuynhtan
Aug 5, 2018
Writing Feedback / Ielts Writing Task 1: The graph shows radio and television audiences throughout the day in 1992. [3]
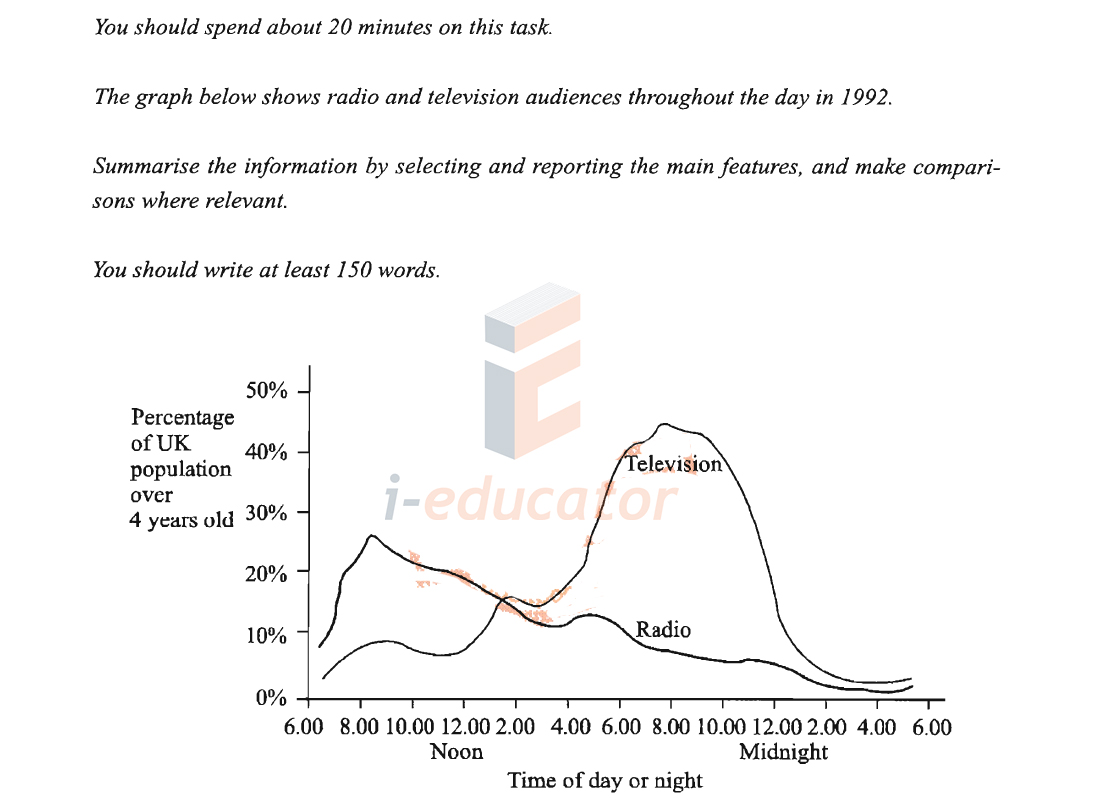
The line graph indicates the changes in the proportion of audiences listening to radio and watching television during the day in 1992.
A quick glance at the graph reveals that there was a downward trend in the amount of radio and television audiences.
At 6 a.m, the figure of radio listeners registered the highest between the two, standing at below 10% of UK population. Then, at around 8:45 a.m, the number increased considerbly to about 26% of UK population. Nonetheless, it declined sharply to roughly 3% of UK population at nearly 6 a.m of next day.
With a similar trend, the bumver of television viewers stood at under 5% of UK population at 6 a.m. After that, at 8 p.m, there was a dramatic rise reaching approximately 45% of UK population. Finally, at nearly 6 a.m of next day, it plunged to around 5% of UK population.
number of TV viewers and radio listeners in the uk
The line graph indicates the changes in the proportion of audiences listening to radio and watching television during the day in 1992.
A quick glance at the graph reveals that there was a downward trend in the amount of radio and television audiences.
At 6 a.m, the figure of radio listeners registered the highest between the two, standing at below 10% of UK population. Then, at around 8:45 a.m, the number increased considerbly to about 26% of UK population. Nonetheless, it declined sharply to roughly 3% of UK population at nearly 6 a.m of next day.
With a similar trend, the bumver of television viewers stood at under 5% of UK population at 6 a.m. After that, at 8 p.m, there was a dramatic rise reaching approximately 45% of UK population. Finally, at nearly 6 a.m of next day, it plunged to around 5% of UK population.

d29ldkc.jpg
