Van Phuc Bui
Aug 17, 2018
Writing Feedback / The graphs compared Japan and Malaysia in terms of five categories of average family expenses - 2010 [3]
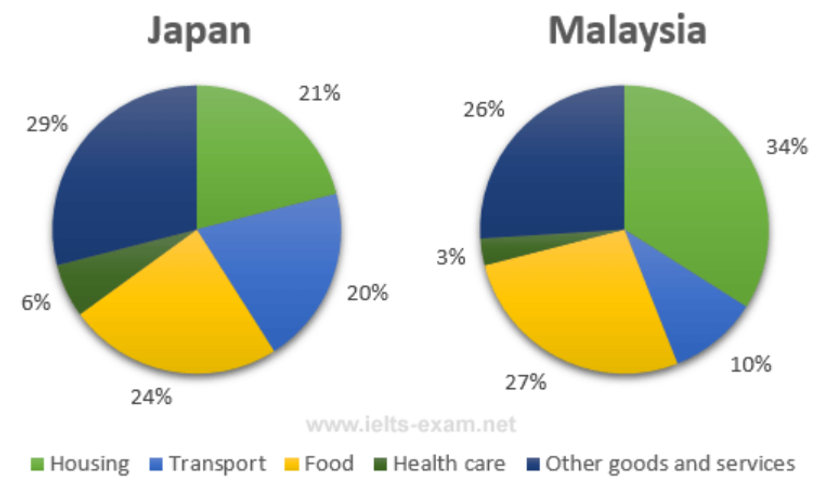
The graphs compared Japan and Malaysia in terms of five categories of average family expenses in 2010.
Overall, in both nations, housing and other goods and services accounted for the largest percentage in 2010. By contrast, families in Japan and Malaysia spent a negligible amount of their budget on healthcare.
In Japan, exactly 20% expenditure was spent on transport, that is 2 times larger than the percentage of their counterparts in Malaysia. In terms of food, the figure for Japan slightly less than that of Malaysia, at 24% and 27% respectively. Families in Malaysia just spent 3% of their budget on health care that was half of their spending plan in Japan.
In Japan, the largest expense was for others good and services, at 29%, while the figure for Malaysia was higher, at 36%. However, spending on housing of Malaysians was 34% which was 13% larger than those of Japanese. (150 words)
household expenditures in Japan and Malaysia
The graphs compared Japan and Malaysia in terms of five categories of average family expenses in 2010.
Overall, in both nations, housing and other goods and services accounted for the largest percentage in 2010. By contrast, families in Japan and Malaysia spent a negligible amount of their budget on healthcare.
In Japan, exactly 20% expenditure was spent on transport, that is 2 times larger than the percentage of their counterparts in Malaysia. In terms of food, the figure for Japan slightly less than that of Malaysia, at 24% and 27% respectively. Families in Malaysia just spent 3% of their budget on health care that was half of their spending plan in Japan.
In Japan, the largest expense was for others good and services, at 29%, while the figure for Malaysia was higher, at 36%. However, spending on housing of Malaysians was 34% which was 13% larger than those of Japanese. (150 words)

Capture.PNG
