nhatlamielts
Sep 11, 2018
Writing Feedback / The bar chart reveals the change of the proportion of USA citizens (all ages) living alone [2]
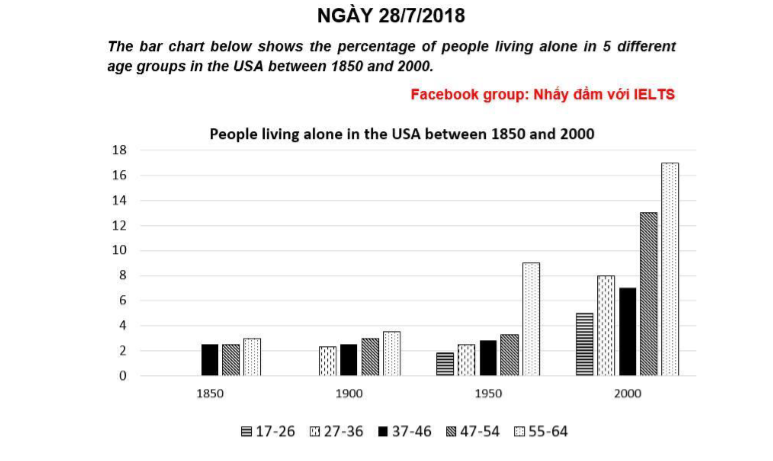
A glance at the bar chart provided reveals the change of the proportion of USA citizens living alone in terms of various age groups over one and a half century from 1850.
Looking at the graph, It is immediately obvious that more and more people in more age groups decided to live alone, especially the 55-64 age group.
According to the chart, in 1850, the percentage of alone people was not considerable and majority in three age groups, which were the 37-46, 47-54 and 55-64 age group. However, 5 decades later, there appeared add an new age group living alone, which was the 27-36, account for over 2%. Meanwhile, others showed a slightly upward trend, exception the 37-46 age group remained stable.
As can be seen from the graph, from 1950, there were 5 main age groups living alone. During 50 years later, the percentage of alone people dramatically increase. The 55-64 age groups was still made up the highest proportion, while people from 27-36 years old took over the 37-46 age group.
Essay for ielts writing task 1
A glance at the bar chart provided reveals the change of the proportion of USA citizens living alone in terms of various age groups over one and a half century from 1850.
Looking at the graph, It is immediately obvious that more and more people in more age groups decided to live alone, especially the 55-64 age group.
According to the chart, in 1850, the percentage of alone people was not considerable and majority in three age groups, which were the 37-46, 47-54 and 55-64 age group. However, 5 decades later, there appeared add an new age group living alone, which was the 27-36, account for over 2%. Meanwhile, others showed a slightly upward trend, exception the 37-46 age group remained stable.
As can be seen from the graph, from 1950, there were 5 main age groups living alone. During 50 years later, the percentage of alone people dramatically increase. The 55-64 age groups was still made up the highest proportion, while people from 27-36 years old took over the 37-46 age group.

ielts_writing_task_1.png
