trung3110
Sep 24, 2018
Writing Feedback / The table shows the obesity rate in one country over a period of time - TASK 1 [2]
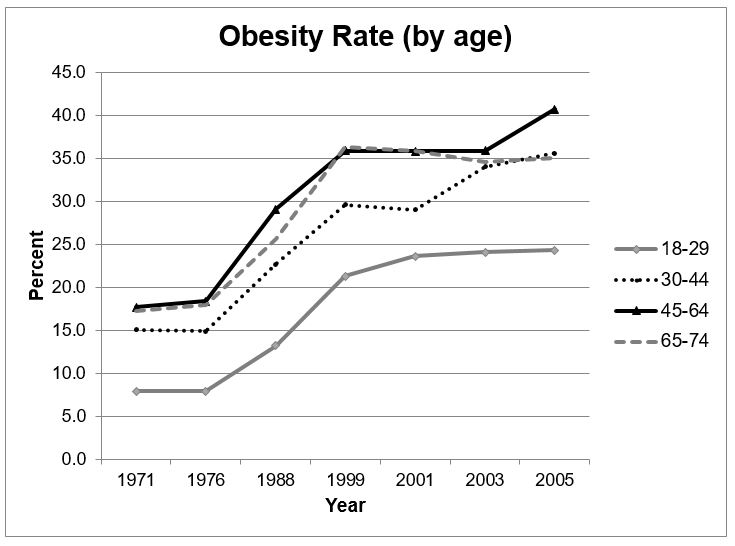
The line chart compares and contrasts data on the difference in obesity proportion of a country in four age categories from 1971 to 2005.
Looking at the graph, it is immediately obvious that obesity proportion underwent an upward trend over shown time. Generally speaking, the higher the age is, the easily people get obesity.
Initially, the obesity proportion in 18-29 age group stood steady then sharply increased from 1976 to 1999. Likewise, other groups of age doubled. In 1999, the 18-29 age group continuously increased and peaked at about 25% in 2005.
While the proportions of other groups experienced an increase in 1999-2005, the oldest group slightly declined to over one-third. The 30-44 age group fluctuated because of a decrease in 1999 and a rapid increase in 2001. The 45-64 age group reached a peak in 2005 by about 40% and seemingly had the highest proportion all time compared to other groups in the shown time.
obesity proportion in four age categories
The line chart compares and contrasts data on the difference in obesity proportion of a country in four age categories from 1971 to 2005.
Looking at the graph, it is immediately obvious that obesity proportion underwent an upward trend over shown time. Generally speaking, the higher the age is, the easily people get obesity.
Initially, the obesity proportion in 18-29 age group stood steady then sharply increased from 1976 to 1999. Likewise, other groups of age doubled. In 1999, the 18-29 age group continuously increased and peaked at about 25% in 2005.
While the proportions of other groups experienced an increase in 1999-2005, the oldest group slightly declined to over one-third. The 30-44 age group fluctuated because of a decrease in 1999 and a rapid increase in 2001. The 45-64 age group reached a peak in 2005 by about 40% and seemingly had the highest proportion all time compared to other groups in the shown time.

The table shows the obesity rate in one country over a period of time. Summarise the information by
