annisaelda13
Oct 19, 2018
Writing Feedback / Marriages and divorces in the USA - Writing Task 1 for IELTS (Graph) [NEW]
Hi Everyone! I need your feedback in term of writing ielts task 1 (Task Achievement, Lexical Resources, Cohesion and Coherence, Grammatical and Accuracy)
=======================================
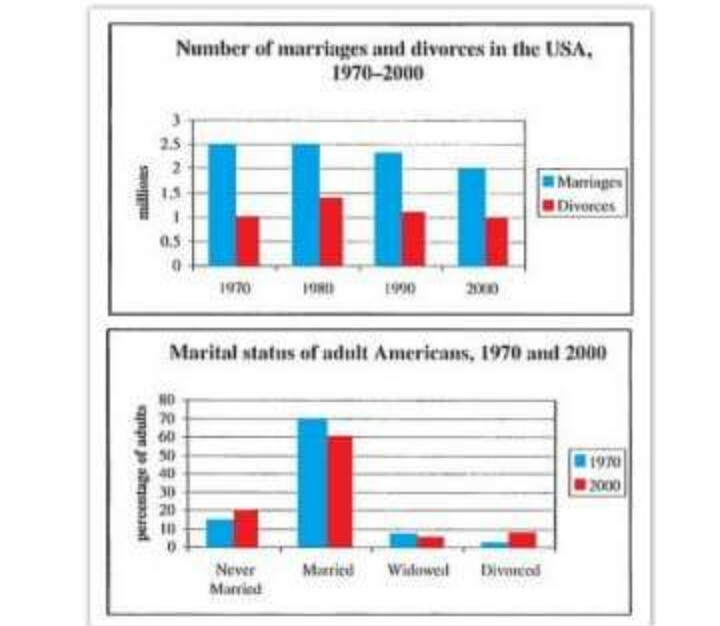
Question : Number of marriages and divorces in the USA, 1970-2000 and marital status of adult Americans, 1970 and 2000.
The two graphs illustrate that the amount of American who settle down and divorce from 1970 to 2000, and the civil status of american mature between 1970 and 2000. Obviously, there was a moderate decline in the number of tie the knot from 1970 to 2000, whilist divorces depict a slight fluctuation for American, but divorces also remained relatively stable in the period under review.
According to the graph, the number of settle down in American experienced remain stable, with 2.5 millions throughout one decades from 1970 to 1980. By following the years, the category of divorces indicated that rose slightly approximately 1.5 millions. On the other hand, the number of marriages experienced a slight decrease until the last year at 2 millions, while the category of American who were divorced a drop slightly in the last year, which had similar figures as in the beginning year.
Regarding Americans mature, the highest proportion of marital status in American were married, accounted for seven in ten and three-fifth in both of years. In the early year, the number of never married experienced a slight growth with almost 15% and exactly at 20% in the last year. However, both widowed and divorced were insignificant at less than a tenth each.

Screenshot_2018101.jpg
