Jin_KT
Apr 4, 2019
Writing Feedback / IELTS writing task 1 - line graph of waste produced [3]
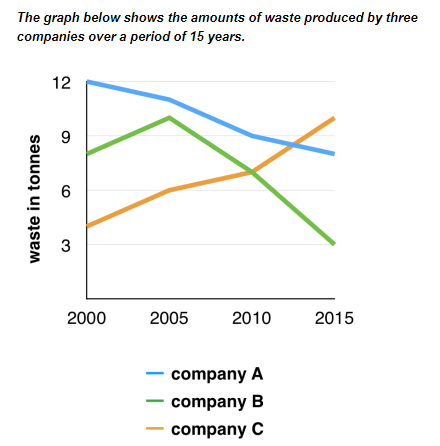
@DoctorWho Thanks for your feedback. I divided into 2 periods of time that were 2000-2005 and 2005-2015 for 2 bodies so i didn't mention the data for years 2010. I tried to describe the general trend of each periods cause I thought it would be complex if i mentioned much data. I'll correct my errors. Can u help me distinguish "figure for" and "figure of"? I was taught that "for" was usually attached to "figure". Thanks a lot <3
@DoctorWho Thanks for your feedback. I divided into 2 periods of time that were 2000-2005 and 2005-2015 for 2 bodies so i didn't mention the data for years 2010. I tried to describe the general trend of each periods cause I thought it would be complex if i mentioned much data. I'll correct my errors. Can u help me distinguish "figure for" and "figure of"? I was taught that "for" was usually attached to "figure". Thanks a lot <3

