Writing Feedback /
The graph illustrates immigration, emigration and net migration rate in the UK from 1999 to 2008 [3]
[Writing task 1] International migration in UK
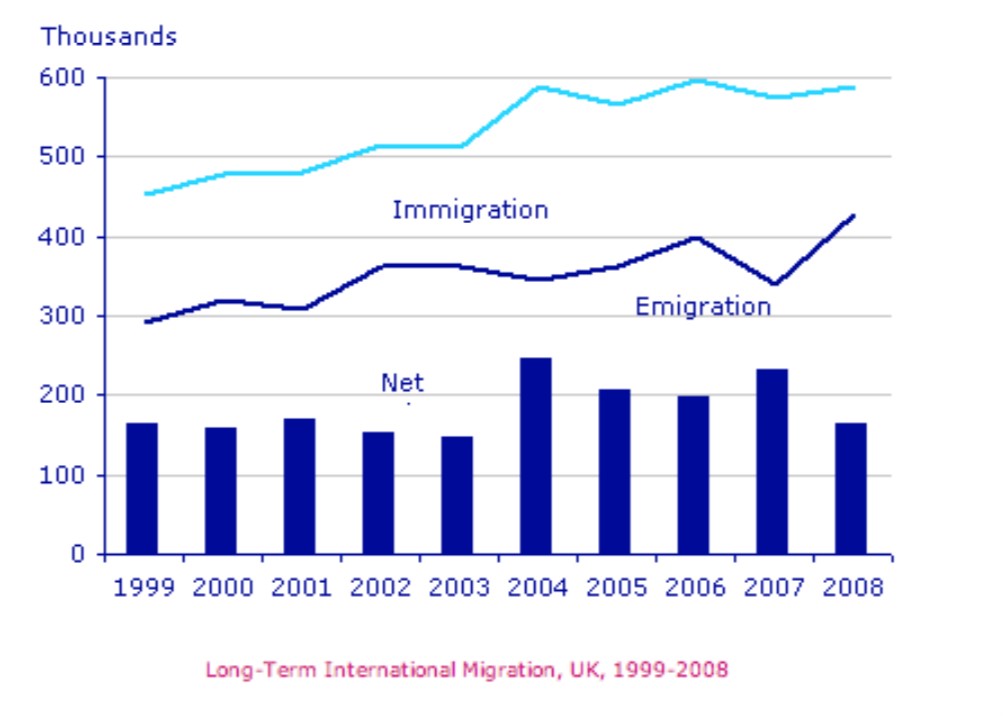
The graph illustrates immigration, emigration and net migration rate in the UK from 1999 to 2008.
Overall, the rates of immigration and emigration in the UK rose between 1999 and 2008, but the figures for immigration were significantly higher. It is clear that the net migration rate was positive over the period shown and peaked in 2004 and 2007.
In 1999, over 450,000 people came to live in the UK, while the number of people who emigrated stood at just under 300,000. The immigration rate rose sharply in 2004 and peaked at 600,000 in 2006. However, the emigration rate saw a decline in 2007 before increasing to the highest point of about 420,000 people in the next year.
The net migration figure was about 180,000 in 1999, and it remained at a similar level until 2003. The UK net migration reached a peak of almost 240,000 in 2004 and 2007 before falling back to 180,000 in 2008.

EE7CF7B270DB4CA2.jpg

