Writing Feedback /
IELTS Task 1: The bar chart show the petroleum production and consumption among 7 regions in 2002 [3]
amount of petroleum produced
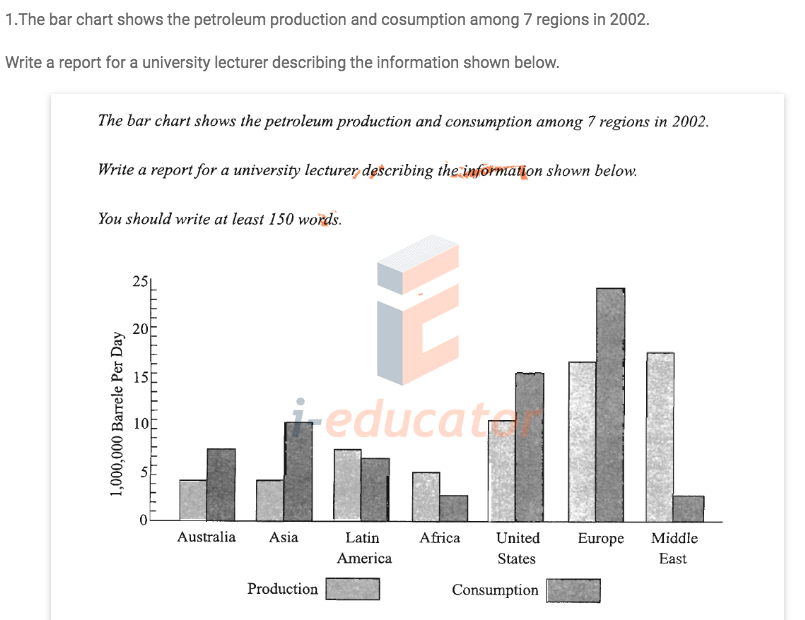
The bar chart compares seven distinct areas in terms of the amount of petroleum that they produced and consumed in the period of 2002.
Overall, 4 out of 7 surveyed regions used their products in a higher level that they produced. Besides, Middle East was the biggest petroleum producer, while Europe's petroleum usage was the highest.
In 2002, Europe and Middle East provided the same amount of petroleum at nearly 7 million barrels on a daily basis. However, the former consumed around 25 million barrels per day, which was nearly 10 times as high as that of the latter. The United State's petroleum products were above 10 million barrels, less than the figure for its usage, at 16 million barrels per day.
The amount of petroleum spent in Australia and Asia was 7 and 11 million barrels per day, respectively, though, they both generated just over 4 million barrels. By contrast, Latin America's and Africa's product statistics exceeded their usage ones. The difference in Latin was insignificant, whereas figures for its counterpart were 6 million barrels produced and 3 million barrels used.

ScreenShot201905.png

