Writing Feedback /
The bar chart illustrates the age distribution of Australians who did regular physical activity [4]
IELTS TASK 1: 'physical activity' bar chart
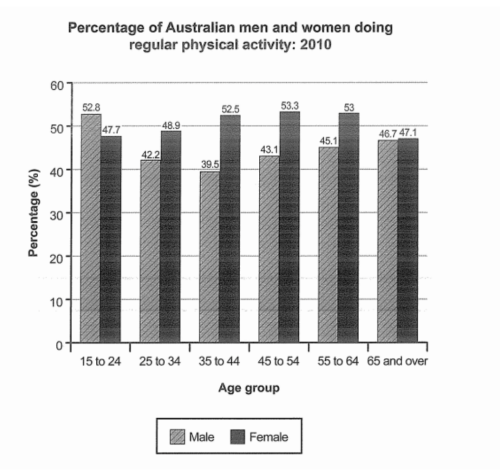
The bar chart below shows the percentage of Australian men and women in different age groups who did regular physical activity in 2010.The bar chart illustrates the age distribution of Australian people in both genders who did regular physical activity in 2010.
Overall, women did more excercises than men in all age groups, except for the teenagers. Besides, the boys aged 15-24 and the women aged 45-54 had the highest percentage of total people excercising.
Looking first at the female Australian, there are over 50% of people whose age ranged from 35 to 64 doing physical activity regularly, while the figure for the opposite gender was much lower, at approximately 40% to 45%. The 15 - 24 age group is the only group that the number of males excercising frequently are higher than that for females, with 52,8% and 47,7% respectively.
Regarding the 25-34 age group, the figure for females is higher than that for males, at 48,9% and 42,2% respectively. Women and men aged 65 or older have similar figures or people excercising regularly, around 47% each.

6a0120a5bb05d8970c02.png

