Writing Feedback /
Changes to price of food products from 1978 to 2009 - IELTS 1 [3]
trend of consumer-price index
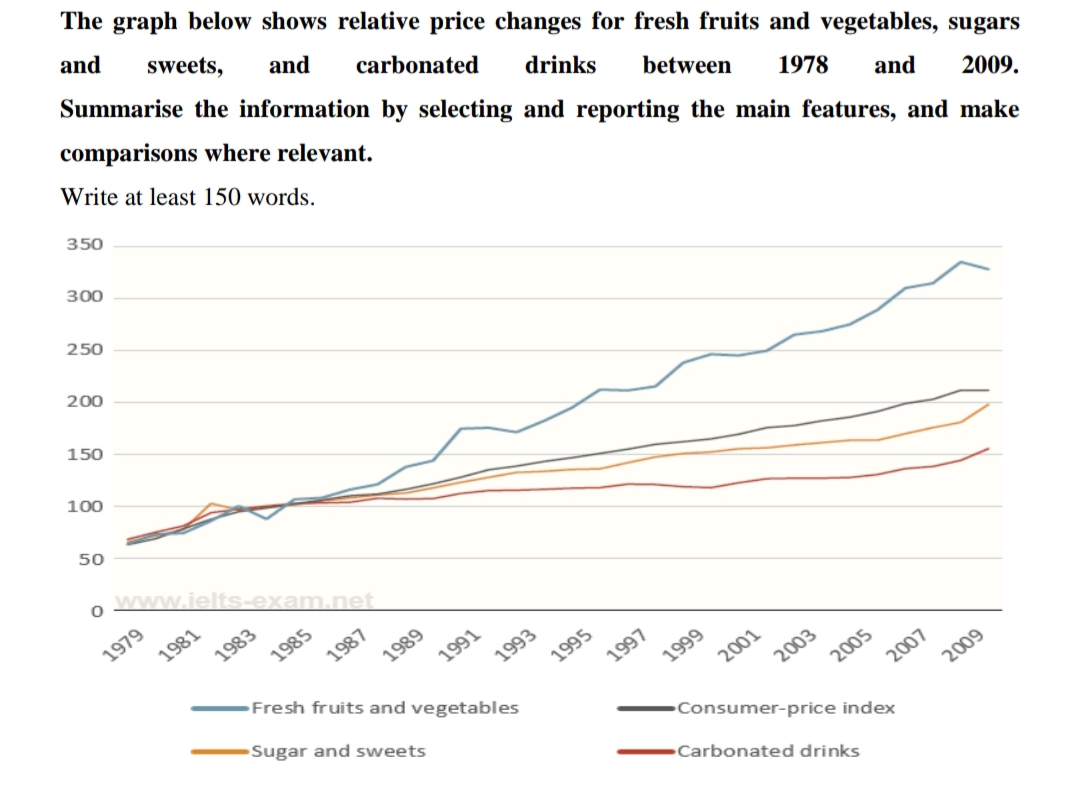
The line graph illustrates general trend of consumer-price index and provides information about the changes in price of three food product groups from 1978 to 2009.
Overall, it is clear that there was an upward trend in these products, albeit some fluctuations. Only the price of fresh fruits and vegetables witnessed a significant rise, which was higher than the rise in the general consumer-price index.
Over this 30-year period, the figure for fresh fruits and vegetable rise sharply from 30 in 1979 to approximately 330 in 2009. Despite the same figure of about 60 at the starting point of the period, the changes in price for this product was the highest number compare with others.
Meanwhile, sugar and sweets and carbonated drinks showed similar trends. After many minor variations, the number for sugar and sweets was 200 on the graph in 2009 and higher than the final figure for carbonated drinks at 150. However, they were consistently below the consumer-price index average after 1987, which rose rapidly from around 60 idén 1979 to over 200 in 2009.

20190802_004355.jpg

