ngotrancamtu
Aug 7, 2019
Writing Feedback / WRITING TASK 1: AUSTRALIAN EXPORTATION STATISTICS [2]
The graph below shows
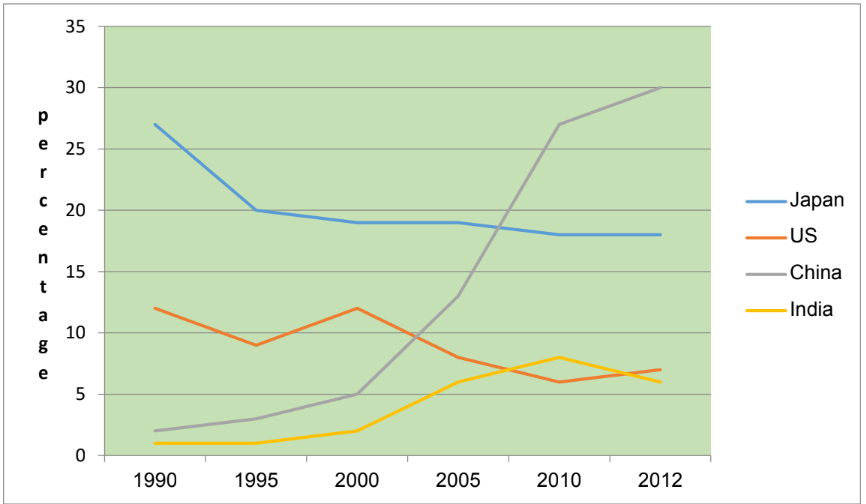
The graph gives information about the figure for Australian exportation in 4 countries, namely Japan, the US, China and India over a period of 22 years.
Overall, it can be seen from the graph that the proportion of exports to Japan and the US significantly dropped, whereas that of China and India increased considerably. In addition, the country which reached the highest percentage of exports at the end of the period was Japan.
In 1990, the percentage of exports to Japan and the US was 20% and 9% respectively. Besides, the proportion of exports to India was 1%, which was lower than that of China, at 2.5%. Over the next 5 years, the proportion of exports to both Japan and the US considerably decreased to 20% and 9% respectively. While exports to India remained stable at 1% and the figure for China had a slight rise of 3% in 1995.
In 2012, there was a gradual fluctuation in the percentage of exports to the US, which stood at 7% at the end of the period. At the same time, the figure for Japan steadily went down of 17%. By contrast, exports to Japan rapidly increased by 1% to 6%. But the most enormous change, however, was the percentage of exports to Japan which reached a peak of 30% in 2012.
The graph below shows
the percentage of Australian exports to 4 countries from 1990 to 2012
.The graph gives information about the figure for Australian exportation in 4 countries, namely Japan, the US, China and India over a period of 22 years.
Overall, it can be seen from the graph that the proportion of exports to Japan and the US significantly dropped, whereas that of China and India increased considerably. In addition, the country which reached the highest percentage of exports at the end of the period was Japan.
In 1990, the percentage of exports to Japan and the US was 20% and 9% respectively. Besides, the proportion of exports to India was 1%, which was lower than that of China, at 2.5%. Over the next 5 years, the proportion of exports to both Japan and the US considerably decreased to 20% and 9% respectively. While exports to India remained stable at 1% and the figure for China had a slight rise of 3% in 1995.
In 2012, there was a gradual fluctuation in the percentage of exports to the US, which stood at 7% at the end of the period. At the same time, the figure for Japan steadily went down of 17%. By contrast, exports to Japan rapidly increased by 1% to 6%. But the most enormous change, however, was the percentage of exports to Japan which reached a peak of 30% in 2012.

writingtask1.PNG
