vancandoit
Oct 2, 2019
Writing Feedback / IELTS - the amounts of waste produced by three corporations from 2000 to 2015 [3]
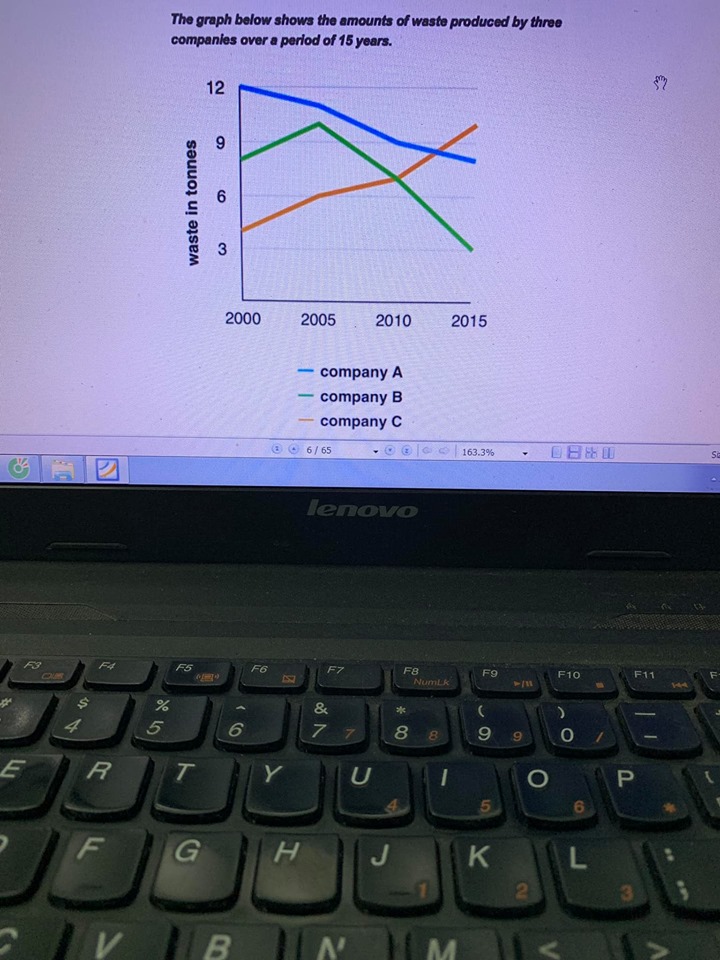
The line graph illustrates the amounts of waste produced by three companies over a period of 15 years. It is evident that The percentage of wastes of which the place saw a rapid change. Both companies A and B followed by the downward trend as oppose to the tones of waste in company C was rose considerably
Note: please give me a comment about my overview about line graph.
ielts general training-line graph
The line graph illustrates the amounts of waste produced by three companies over a period of 15 years. It is evident that The percentage of wastes of which the place saw a rapid change. Both companies A and B followed by the downward trend as oppose to the tones of waste in company C was rose considerably
Note: please give me a comment about my overview about line graph.

72133859_17138649087.jpg
