amanda shao
Oct 22, 2019
Writing Feedback / The chart bellow shows the percentage of people who ate five portions of fruit and vegetables [2]
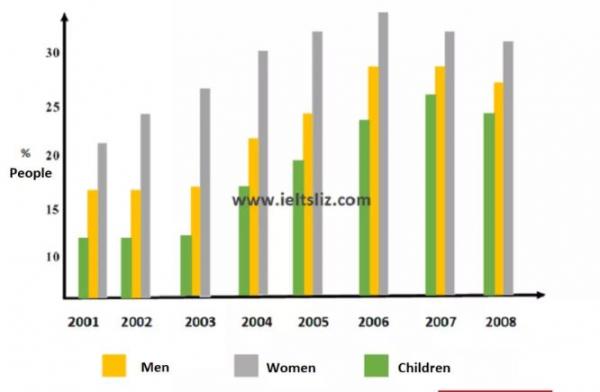
The bar chart presents information about how many people who ate five times of fruit and vegetables a day over the period 2001 to 2008 in UK.
Overall, we can see that the percentage who ate the health food of the highest women in 2006 and men in 2006 and 2007 whereas children in 2007. the low of women in 2001 and men and children in 2001 and 2002 and 2003.
It is clear that women had the highest percentage of eating healthy food at around 35% in 2006 and low by about 20% in 2001. Men were at high level for ate fruit and vegetables by 27% in 2006 and 2007 and the minority of fruit and vegetables at 16% in 2001 and 2002 and 2003. Children were the most by 25% in 2007 and the lower than other groups with 14% in 2001 and 2002 and 2003.
healthy food consumption in the uk
The bar chart presents information about how many people who ate five times of fruit and vegetables a day over the period 2001 to 2008 in UK.
Overall, we can see that the percentage who ate the health food of the highest women in 2006 and men in 2006 and 2007 whereas children in 2007. the low of women in 2001 and men and children in 2001 and 2002 and 2003.
It is clear that women had the highest percentage of eating healthy food at around 35% in 2006 and low by about 20% in 2001. Men were at high level for ate fruit and vegetables by 27% in 2006 and 2007 and the minority of fruit and vegetables at 16% in 2001 and 2002 and 2003. Children were the most by 25% in 2007 and the lower than other groups with 14% in 2001 and 2002 and 2003.

.jpeg
