wuu_u
Oct 28, 2019
Writing Feedback / In the chart numbers of waste that were produced by Ireland, Japan, Korea, Poland, Portugal, and US [4]
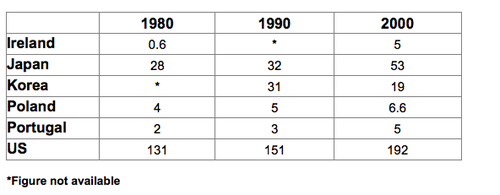
The chart gives the numbers of waste that were produced by Ireland, Japan, Korea, Poland, Portugal, and the US from 1980 to 2000.
Overall, the US produced the greatest amount of waste between 1980 and 2000. It is also clear that Korea was the only country that reduced its number of waste production from 1990 to 2000.
From 1980 to 2000, the amount of waste produced by the US increased from 131 to 192 million tonnes, and the number of wast production in Japan also significantly rose nearly two-times, which is from 28 to 53 million tonnes. Similarly, wast production from Poland and Portugal slightly decreased from 4 to 6.6 million tonnes and from 2 to 5 million tonnes respectively.
During 2 decades, waste production from Ireland increased dramatically to 5 million tonnes, a rise of almost 4.5 million tonnes. By contrast, the number of waste produced by Korea saw a noticeable fall to 19 million tonnes from 1990 to 2000.
IELTS Task 1 : 'waste production' table essay
The chart gives the numbers of waste that were produced by Ireland, Japan, Korea, Poland, Portugal, and the US from 1980 to 2000.
Overall, the US produced the greatest amount of waste between 1980 and 2000. It is also clear that Korea was the only country that reduced its number of waste production from 1990 to 2000.
From 1980 to 2000, the amount of waste produced by the US increased from 131 to 192 million tonnes, and the number of wast production in Japan also significantly rose nearly two-times, which is from 28 to 53 million tonnes. Similarly, wast production from Poland and Portugal slightly decreased from 4 to 6.6 million tonnes and from 2 to 5 million tonnes respectively.
During 2 decades, waste production from Ireland increased dramatically to 5 million tonnes, a rise of almost 4.5 million tonnes. By contrast, the number of waste produced by Korea saw a noticeable fall to 19 million tonnes from 1990 to 2000.

317038_1_o.png
