dhcuber
Nov 30, 2019
Writing Feedback / IELTS Task 1 mixed with table and pie chart - people in Australia [2]
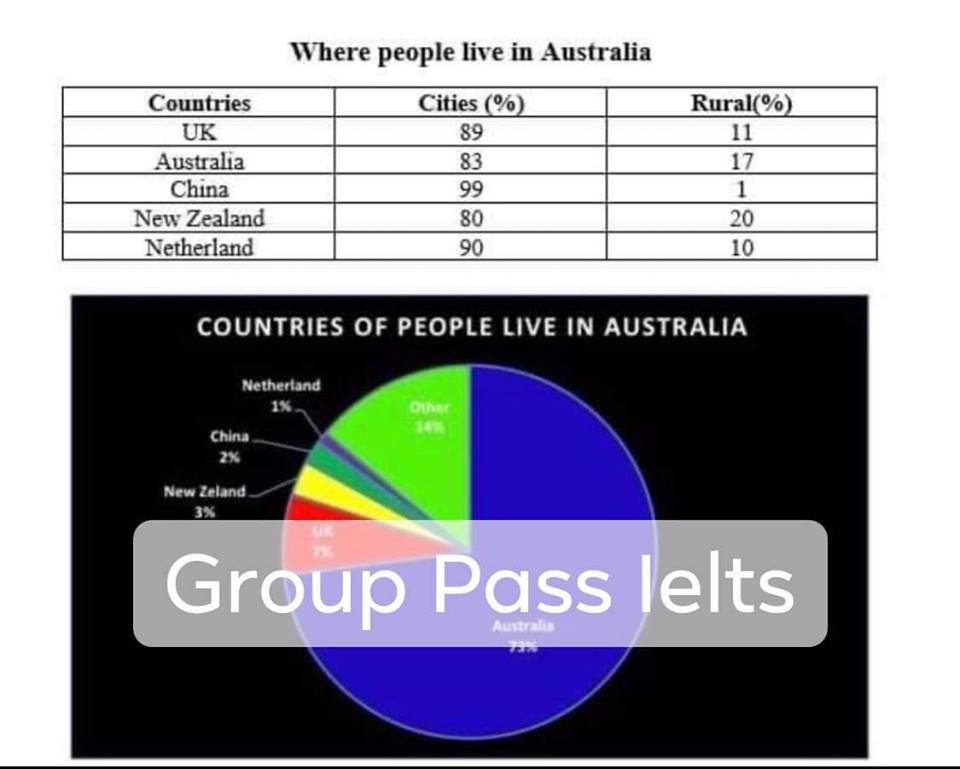
The first chart compares the percentage of accommodation in Australia from two different types of place in five nations namely UK, Australia, China, New Zealand and Netherland. The following chart provides data about birthplace of people who living in Australia.
Overall, it can be clearly seen that almost people who are living in Australia prefer to stay in cities rather than countryside. In addition, beside of Australian, English people accounted for a large proportion between five nations lived in Australia.
Regarding the table, from five countries, people who lived in cities are more than countryside. China has the highest difference in proportion of people who living in cities and rural with 99% and only 1%, respectively. After that, UK and Netherland have the second disparity in percentage with nearly 90% people lived in cities and only 10% lived in countryside. Australian and New Zealander have lower figures with 83% and 80% people lived in cities, respectively.
Meanwhile, beside of Australian, almost inhabitants lived in Australia are from UK and other nations with 7% and 14%, respectively. The percentage of people living in Australia in New Zealand and China is lower with 3% New Zealander and 2% Chinese. Hollander who lived in Australia have the lowest percentage with only 1%.
spectrum of australian society
The first chart compares the percentage of accommodation in Australia from two different types of place in five nations namely UK, Australia, China, New Zealand and Netherland. The following chart provides data about birthplace of people who living in Australia.
Overall, it can be clearly seen that almost people who are living in Australia prefer to stay in cities rather than countryside. In addition, beside of Australian, English people accounted for a large proportion between five nations lived in Australia.
Regarding the table, from five countries, people who lived in cities are more than countryside. China has the highest difference in proportion of people who living in cities and rural with 99% and only 1%, respectively. After that, UK and Netherland have the second disparity in percentage with nearly 90% people lived in cities and only 10% lived in countryside. Australian and New Zealander have lower figures with 83% and 80% people lived in cities, respectively.
Meanwhile, beside of Australian, almost inhabitants lived in Australia are from UK and other nations with 7% and 14%, respectively. The percentage of people living in Australia in New Zealand and China is lower with 3% New Zealander and 2% Chinese. Hollander who lived in Australia have the lowest percentage with only 1%.

78323346_51576163261.jpg
