cacoco
Dec 15, 2019
Writing Feedback / [IELTS] Writing task 1, Three charts with average percentages in different types of nutrients [2]
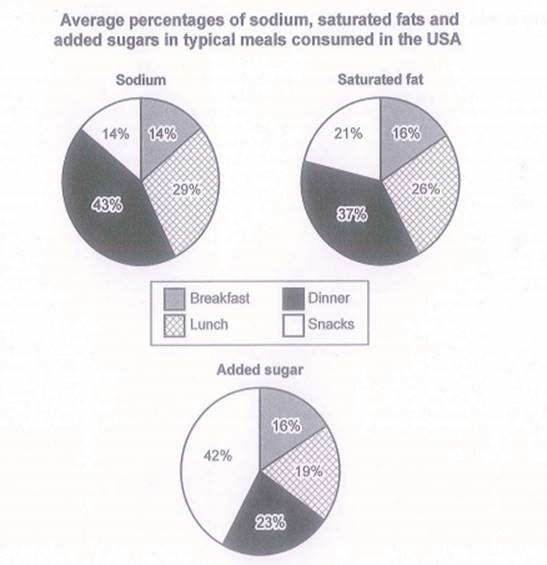
Given are the pie charts illustrate the average percentages of three different types of additives added in food in the USA, which are sodium, saturated fat, and added sugar. If any of which consumed too much by people, it may be unhealthy to human body.
The chart of sodium demonstrate that people consume it the most during dinner, which made up to 43%, and it remain constant while having breakfast and lunch. Meanwhile, just as sodium, dinner also reveal the biggest portion of the chart, but there are a slight difference between snacks and breakfast, 21% for snacks and 16% for breakfast.
When it comes to added sugar, it is crystal clear that people consume it the most for snacks, and less for breakfast. At the end, it is interesting to find out people are having a nicer and healthier meal for breakfast, and tend to have an unhealthy meal for dinner.
sodium, fats and sugars in american meals
Given are the pie charts illustrate the average percentages of three different types of additives added in food in the USA, which are sodium, saturated fat, and added sugar. If any of which consumed too much by people, it may be unhealthy to human body.
The chart of sodium demonstrate that people consume it the most during dinner, which made up to 43%, and it remain constant while having breakfast and lunch. Meanwhile, just as sodium, dinner also reveal the biggest portion of the chart, but there are a slight difference between snacks and breakfast, 21% for snacks and 16% for breakfast.
When it comes to added sugar, it is crystal clear that people consume it the most for snacks, and less for breakfast. At the end, it is interesting to find out people are having a nicer and healthier meal for breakfast, and tend to have an unhealthy meal for dinner.

task 1
