joseipg
Feb 17, 2020
Writing Feedback / Turtles in India (four different species) - IELTS Writing Task 1, line graph [3]
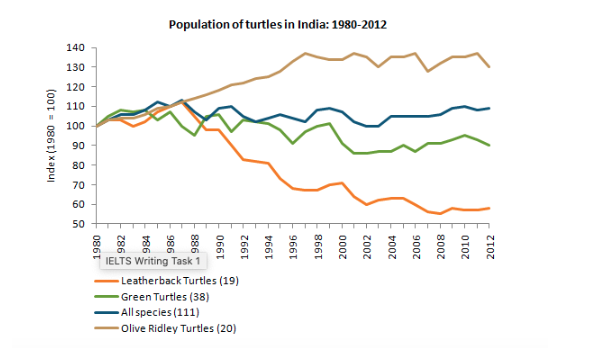
The line graph illustrates the number of turtles across four different species in India over a 32-year period from 1980 to 2012.
Overall, what stands out from the line graph is that while Olive Ridley Turtles experienced an increase, LeatherBack Turtles and Green Turtles witnessed a fall during the period. Moreover, All species remained almost constant throughout the period with some minor fluctuations. Additionally, all four species started with the same figure in 1980.
On the one hand, Olive Ridley Turtles' figures rose with small oscillations from 100 turtles in 1980 to approximately 130 turtles in 2012. This represent an increase of 30 turtles, which is the biggest increase in the four species. In contrast, LeatherBack Turtles' and Green Turtles' numbers experienced a steady decline from 100 turtles for both at the beginning to roughly 57 turtles and 90 turtles. The former stands with the biggest decrease in their numbers with 43 turtles.
On the other hand, All species stay approximately constant with some minor fluctuations between 110 turtles and 99 turtles.
turtles population statistic
The line graph illustrates the number of turtles across four different species in India over a 32-year period from 1980 to 2012.
Overall, what stands out from the line graph is that while Olive Ridley Turtles experienced an increase, LeatherBack Turtles and Green Turtles witnessed a fall during the period. Moreover, All species remained almost constant throughout the period with some minor fluctuations. Additionally, all four species started with the same figure in 1980.
On the one hand, Olive Ridley Turtles' figures rose with small oscillations from 100 turtles in 1980 to approximately 130 turtles in 2012. This represent an increase of 30 turtles, which is the biggest increase in the four species. In contrast, LeatherBack Turtles' and Green Turtles' numbers experienced a steady decline from 100 turtles for both at the beginning to roughly 57 turtles and 90 turtles. The former stands with the biggest decrease in their numbers with 43 turtles.
On the other hand, All species stay approximately constant with some minor fluctuations between 110 turtles and 99 turtles.

Population of turtles in India
