EdwardDowney
Mar 11, 2020
Writing Feedback / IELTS 1 - MIX CHART women who were poverty-stricken & the poverty ratio in the USA [3]
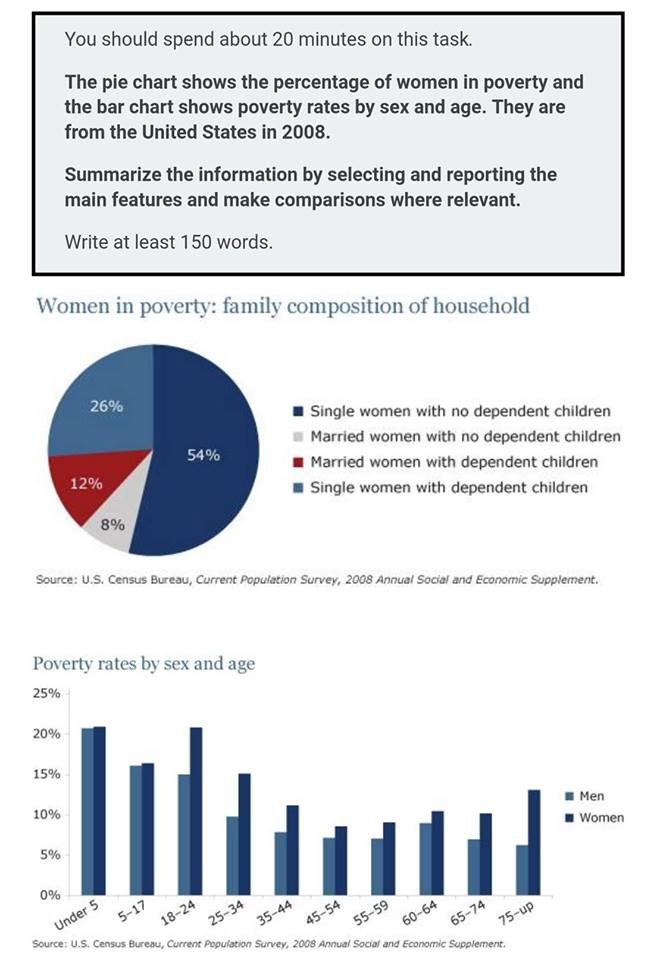
The supplied pie chart shows the percentage of women who were poverty-stricken while the presented bar illustrates the poverty ratio according to gender and age group in USA in 2008.
Overall, women without children is comprised the largest proportion of the given pie chart. Furthermore, women, generally, had a higher poverty rate compares to man.
In the pie chart, it is remarkable that single women without children had the highest percentage of poverty rate while married women without any kids made up of the smallest one, at 54% and 8% respectively. Married women with dependent children and single women with kids accounted for remaining roughly two fifth.
In the bar chart, it is obvious that women was suffered poverty more than man regardless age group in the given year. Moreover, the age group "under 5" and"18-24" reached the peak at just over 20% while the lowest point was recorded at just under 10% among people who are "45 - 54".
Hello all. I'm a new member in this forums. I would like to say thanks to any one read this in advance. Really appreciated any comment below.
Women in poverty and percentage poverty rage by sex and age
The supplied pie chart shows the percentage of women who were poverty-stricken while the presented bar illustrates the poverty ratio according to gender and age group in USA in 2008.
Overall, women without children is comprised the largest proportion of the given pie chart. Furthermore, women, generally, had a higher poverty rate compares to man.
In the pie chart, it is remarkable that single women without children had the highest percentage of poverty rate while married women without any kids made up of the smallest one, at 54% and 8% respectively. Married women with dependent children and single women with kids accounted for remaining roughly two fifth.
In the bar chart, it is obvious that women was suffered poverty more than man regardless age group in the given year. Moreover, the age group "under 5" and"18-24" reached the peak at just over 20% while the lowest point was recorded at just under 10% among people who are "45 - 54".
Hello all. I'm a new member in this forums. I would like to say thanks to any one read this in advance. Really appreciated any comment below.

E1E5C02F7FA14D108.jpeg
