Writing Feedback /
Household living - WRITING TASK 1_BAR CHART_CAMBRIDGE 13 TEST 2 [5]
owned or rented accommodation
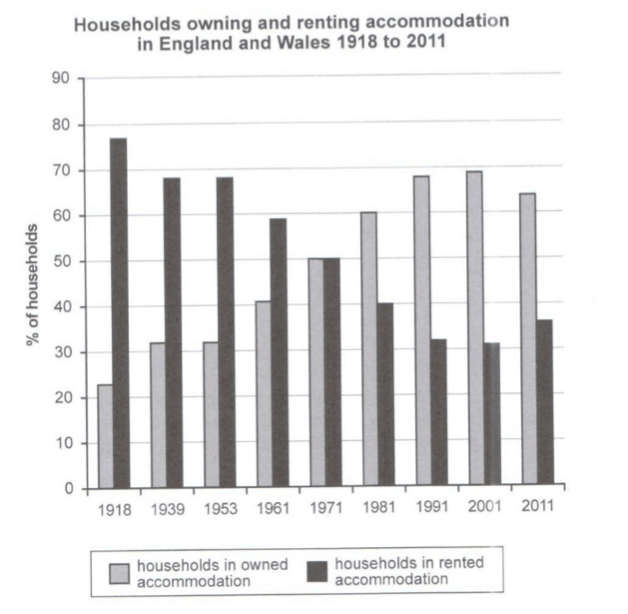
The bar chart illustrates the rate of households that lived in owned or rented accommodation in England and Wales during 93 years from 1918 to 2011.
Overall, renting accommodation was the category which dominated in the proportion of choice of households, but after that, owing accommodation replaced its and became the most popular type of housing in England and Wales.
In 1918, nearly four-fifths households chose to live in rented accommodation, which quadrupled that of the percentage of owned households. The difference between these two numbers was increasingly shortened. In particular, from 1918 to 1961, the statistics of house in rented accommodation dropped gradually to about three-fifths, while that of owned households increased to more than two-fifths.
Till 1971, the percentages of the two categories of housing stood at the same point, with 50% for each one. At 1981 to 2001, the people who lived in the rented house continued to decrease and reached at the lowest point at 30% in 2001, whereas the rate of household in owned accommodation reached an all-time high when it grew to 70% in the same year. However, there was a recovery to about 35% by household rented accommodation,this means that the number of people in the owned house declined slightly to about 65%.

