momopeach
Mar 28, 2020
Writing Feedback / Export revenues from five different products - IELTS WRITING TASK 1 - Two charts - Cambridge 14 [3]
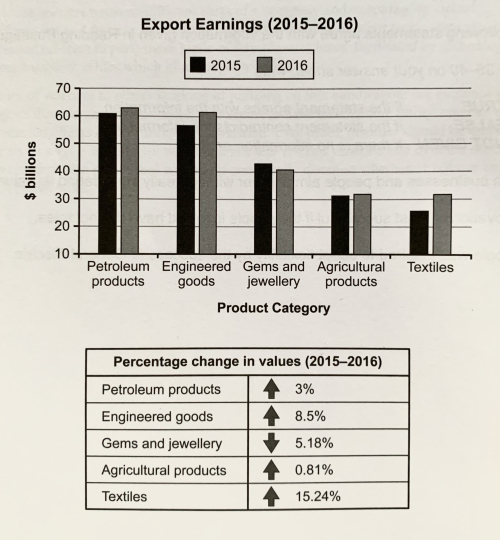
The chart below shows the value of one country's exports in various categories during 2015 and 2016. The table shows the percentage change in each category or exports in 2016 compared with 2015.
The bar chart and table give information about a nation's export revenues from five different types of products in 2015 and 2016
It is noticeable that all categories but gems and jewellery experienced an increase in export earnings. Although petroleum dominated the export industry in the mentioned years, the percentage increase was greatest in the textile category.
Export earnings from petroleum products rose from roughly $61 billion to around $63 billion from 2015 to 2016, which was an increase of 3%. Engineered goods also went through an upward trend in export revenues, with an 8,5% percentage increase from approximately $57 billion in 2015 to $61 billion in the next year.
Among the five categories, gems and jewellery was the only one to reveal a downward tendency. Its earnings decreased 5,18% from $43 billion to around $41 billion. Meanwhile, there was a minimal rise of 0,85% in the export value of agriculture products, from $31 billion to as much as $32 billion.
Despite being the smallest income-generating export in the mentioned period, the textile industry went through a 15,24% growth in earnings from $25 billion to almost $31 billion in 2015 and 2016 respectively.
Export earnings (2015-2016)
The chart below shows the value of one country's exports in various categories during 2015 and 2016. The table shows the percentage change in each category or exports in 2016 compared with 2015.
The bar chart and table give information about a nation's export revenues from five different types of products in 2015 and 2016
It is noticeable that all categories but gems and jewellery experienced an increase in export earnings. Although petroleum dominated the export industry in the mentioned years, the percentage increase was greatest in the textile category.
Export earnings from petroleum products rose from roughly $61 billion to around $63 billion from 2015 to 2016, which was an increase of 3%. Engineered goods also went through an upward trend in export revenues, with an 8,5% percentage increase from approximately $57 billion in 2015 to $61 billion in the next year.
Among the five categories, gems and jewellery was the only one to reveal a downward tendency. Its earnings decreased 5,18% from $43 billion to around $41 billion. Meanwhile, there was a minimal rise of 0,85% in the export value of agriculture products, from $31 billion to as much as $32 billion.
Despite being the smallest income-generating export in the mentioned period, the textile industry went through a 15,24% growth in earnings from $25 billion to almost $31 billion in 2015 and 2016 respectively.

HI.jpg
