mtrhuynh
Apr 28, 2020
Writing Feedback / Writing task 1: GRAPH CHART ABOUT OVERSEAS VISITORS [2]
Hi everyone, I'm new in IELTS and here is my writing task 1. Please kindly help me to check. I post it in two versions.
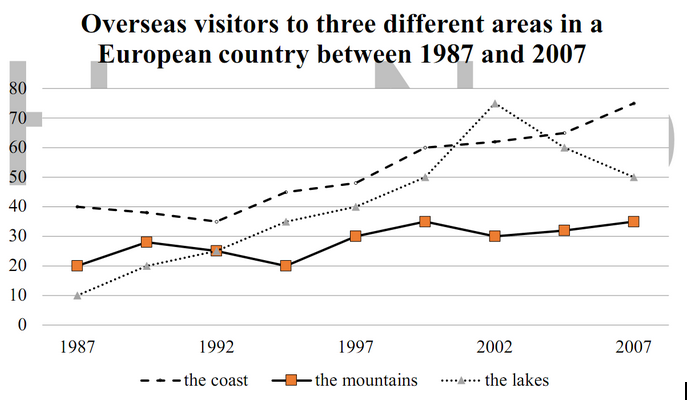
TOPIC: The graph below shows the number of overseas visitors (in thousands) to three different areas in a European country between 1987 and 2007. Summarise the information by selecting and reporting the main features, and make comparisons where relevant.
Version 1
The given chart illustrates the figures of foreign visitors to three different holiday destinations in a European nation from 1987 to 2007.
As can be seen, the coast was the most interesting place, with the figure witnessing the highest number of visitors during this period, except in 2002, when the lakes overtook its leading position and became the most popular tourist attraction.
In 1987-2007, the number of visitors to the coast increased by varying degrees, and then it rose significantly until 2007 to reach its peak of 75,000. There was a dramatic rise in the figure for the lakes from 10,000 in 1987 to 40,000 in 1997, before hitting its peak of about 75,000 in 2002, followed by a sudden drop to 50,000 5 years later. By contrast, the number of overseas visitors to the mountains fluctuated between 20,000 and 30,000 from 1987 to 1997 and then rose slightly to 35,000 in 2007.
One version at a time.
Hi everyone, I'm new in IELTS and here is my writing task 1. Please kindly help me to check. I post it in two versions.
Graph analysis task
TOPIC: The graph below shows the number of overseas visitors (in thousands) to three different areas in a European country between 1987 and 2007. Summarise the information by selecting and reporting the main features, and make comparisons where relevant.
Version 1
The given chart illustrates the figures of foreign visitors to three different holiday destinations in a European nation from 1987 to 2007.
As can be seen, the coast was the most interesting place, with the figure witnessing the highest number of visitors during this period, except in 2002, when the lakes overtook its leading position and became the most popular tourist attraction.
In 1987-2007, the number of visitors to the coast increased by varying degrees, and then it rose significantly until 2007 to reach its peak of 75,000. There was a dramatic rise in the figure for the lakes from 10,000 in 1987 to 40,000 in 1997, before hitting its peak of about 75,000 in 2002, followed by a sudden drop to 50,000 5 years later. By contrast, the number of overseas visitors to the mountains fluctuated between 20,000 and 30,000 from 1987 to 1997 and then rose slightly to 35,000 in 2007.
One version at a time.

6.PNG
