chems
Jul 28, 2020
Writing Feedback / The graph below shows the population for India and China since the year 2000 and predicts population [2]
topic:The graph below shows the population for India and China since the year 2000 and predicts population growth until 2050. Summarise the information by selecting and reporting the main features, and make comparisons where relevant.
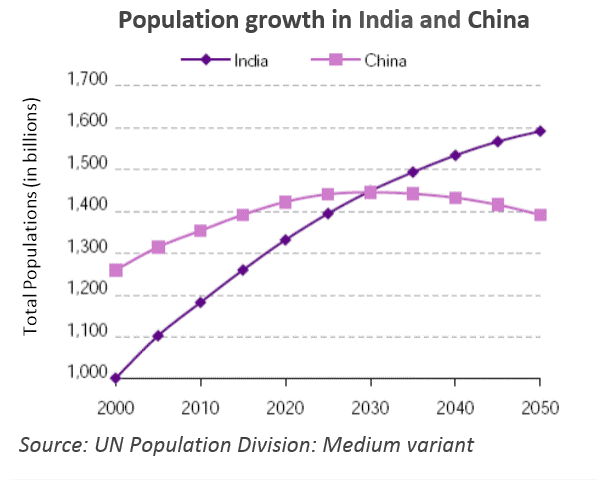
The above line chart displays and predicts the changes of the population figures for India and China from 2000 to 2050. Units are measured in billions. Overall, the two countries will have an increase in population sizes, where India's growth is more rapidly than of China.
Looking at the graph, in 2000, the populace of India started from 1000 billions and China from nearly 1300 billions people. Until now, 2020, the number of citizens of both countries have increased more than 100 billions, especially India with the growth of more than 300 billions in only 20 years.
By 2030, the number of Indians will be equal to the Chinese. The number of Chinese will peak at 1450 billions in 2030, and start falling in the next decades. As China's statistic start to downturn, India's quick growth will help the country to surge ahead. It is estimated that India will have 1,600 billion people as compared to China with 1,400 billion in 2050.
Population growth in two countries
topic:The graph below shows the population for India and China since the year 2000 and predicts population growth until 2050. Summarise the information by selecting and reporting the main features, and make comparisons where relevant.
The above line chart displays and predicts the changes of the population figures for India and China from 2000 to 2050. Units are measured in billions. Overall, the two countries will have an increase in population sizes, where India's growth is more rapidly than of China.
Looking at the graph, in 2000, the populace of India started from 1000 billions and China from nearly 1300 billions people. Until now, 2020, the number of citizens of both countries have increased more than 100 billions, especially India with the growth of more than 300 billions in only 20 years.
By 2030, the number of Indians will be equal to the Chinese. The number of Chinese will peak at 1450 billions in 2030, and start falling in the next decades. As China's statistic start to downturn, India's quick growth will help the country to surge ahead. It is estimated that India will have 1,600 billion people as compared to China with 1,400 billion in 2050.

ieltspopulation.png
