jimzz
Jul 30, 2020
Writing Feedback / The number of a country's exports in a different categories and changes in each type of exports [2]
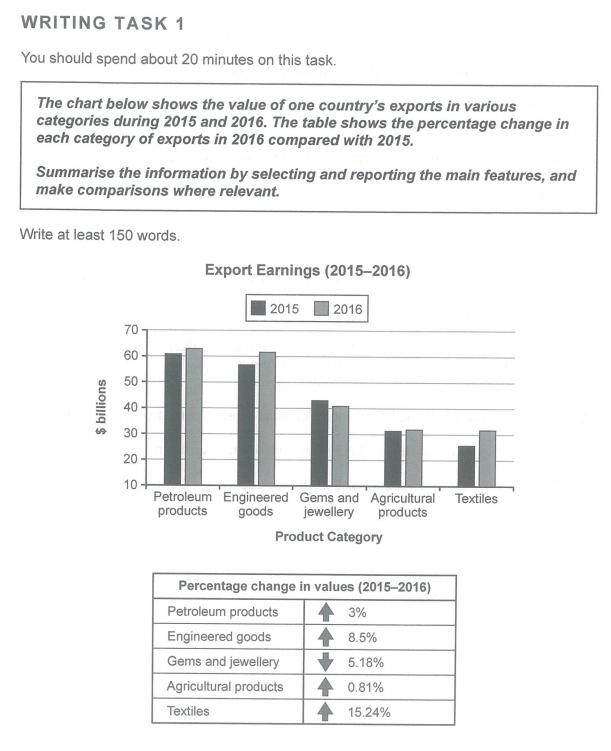
The bar chart below provides the number of a country's exports in a different category and the box demonstrates the proportion change in each type of exports compared in two years.
Generally, petroleum products and engineered goods were creating more value compared with others. Interestingly, only gems and jewellery was recording a fall in number out of all types.
In terms of petroleum products, it rose 3% in a year meanwhile engineered goods increased by 8.5%. They were both received 62 billion of earnings. By contrast, gems and jewellery was following by 41 billion when agricultural and products along with textiles were at the bottom of the table.
About the special part, gems and jewellery decreased from 44 to 41 billion which was representing 5.18% of it. On the other hand, the lowest growth of earning belonged to agricultural products of 0.81% while textiles climbed the most by 15.24% in 2016.
(IELTS WRITING TASK 1) Export earnings
The bar chart below provides the number of a country's exports in a different category and the box demonstrates the proportion change in each type of exports compared in two years.
Generally, petroleum products and engineered goods were creating more value compared with others. Interestingly, only gems and jewellery was recording a fall in number out of all types.
In terms of petroleum products, it rose 3% in a year meanwhile engineered goods increased by 8.5%. They were both received 62 billion of earnings. By contrast, gems and jewellery was following by 41 billion when agricultural and products along with textiles were at the bottom of the table.
About the special part, gems and jewellery decreased from 44 to 41 billion which was representing 5.18% of it. On the other hand, the lowest growth of earning belonged to agricultural products of 0.81% while textiles climbed the most by 15.24% in 2016.

Question
