Writing Feedback /
IELTS - Graph people who are 65 and over in Japan, Sweden, American [5]
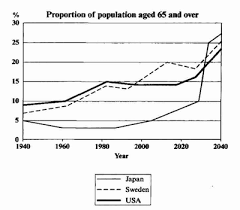
Proportion of population aged 65 and over
The graph illustrates the percentage of people who are 65 and over in Japan, Sweden, American from 1940 and predicts the future trend to 2040.
Overall, all three countries witnessed significant growth in the aging population over a century. Despite the general increasing trend, Japanese elderly people have the most noticeable fluctuation.
In 1940, the proportion of the population aged 65 and above of all three nations was lower 10%. For 60 years, there was a gradual increase in the figure for the USA and Sweden. Besides increasing, the number of people 65 and above of America remained slightly higher than those of Sweden, just about 5%. In contrast, the figure for Japan went down until the 1980s when it began to change direction.
The remainder of the period saw a significant change in the percentage of elderly people in all three countries. The number of older people in the US remained below 15% throughout two-decade before growing considerably to nearly 23% in 2040. During the same period, despite an increasing trend in both Japan and Sweden, a more dramatic rise is predicted between 2030 and 2040 in Japan.

tixung.png

