phuongmai19899
Aug 14, 2020
Writing Feedback / WRITING TASK 1 - The line chart exhibits the comparison between Chinese and American birth rate [3]
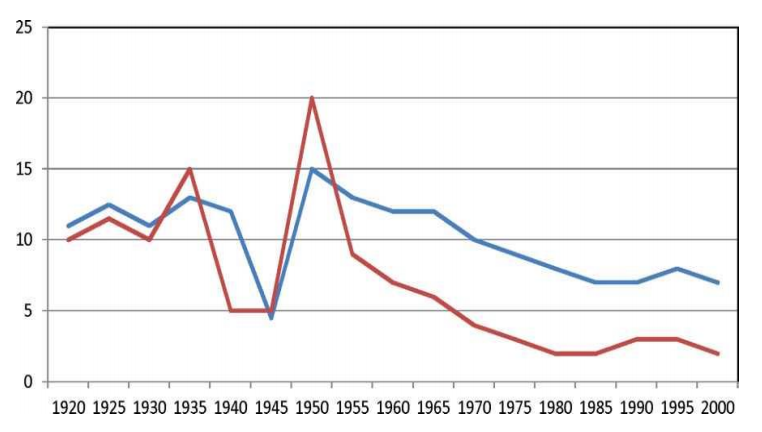
The line chart exhibits the comparison in the Chinese birth rate with the USA one and how it altered over an 80-year period.
From an overall perspective, there was a decline in the birth rate of both countries from 1920 to 2000. Despite the similarity in terms of decreasing trend, the American birth rate still remained higher than the Chinese one in most years.
In the 1920-1950 period, the birth rate of the US wildly fluctuated. There was a sharp fall in the 1940s, from above 10% in 1940 to below 5% 5 years later. However, in 1950, the American birth rate reached the highest point with exactly 15% over 80 years. From 1950 to 2000, the birth rate in the US constantly dropped, which fell to nearly 7% by the year 2000.
Over the same period, the Chinese birth rate had a more varied fluctuation than the American one. From 1940 to 1945, it maintained its level at 5% before it reached the highest point of the whole line graph with 20% in 1950. Nevertheless, it rapidly fell to below 10% just 5 years later and then plummeted nonstop until 2000 with approximately 2%.
THE BIRTH RATES OF CHINA AND THE USA
The line chart exhibits the comparison in the Chinese birth rate with the USA one and how it altered over an 80-year period.
From an overall perspective, there was a decline in the birth rate of both countries from 1920 to 2000. Despite the similarity in terms of decreasing trend, the American birth rate still remained higher than the Chinese one in most years.
In the 1920-1950 period, the birth rate of the US wildly fluctuated. There was a sharp fall in the 1940s, from above 10% in 1940 to below 5% 5 years later. However, in 1950, the American birth rate reached the highest point with exactly 15% over 80 years. From 1950 to 2000, the birth rate in the US constantly dropped, which fell to nearly 7% by the year 2000.
Over the same period, the Chinese birth rate had a more varied fluctuation than the American one. From 1940 to 1945, it maintained its level at 5% before it reached the highest point of the whole line graph with 20% in 1950. Nevertheless, it rapidly fell to below 10% just 5 years later and then plummeted nonstop until 2000 with approximately 2%.

line.PNG
