Writing Feedback /
The charts below show the percentage of volunteers by organizations in 2008 and 2014. [3]
Charts about volunteers in various sectors
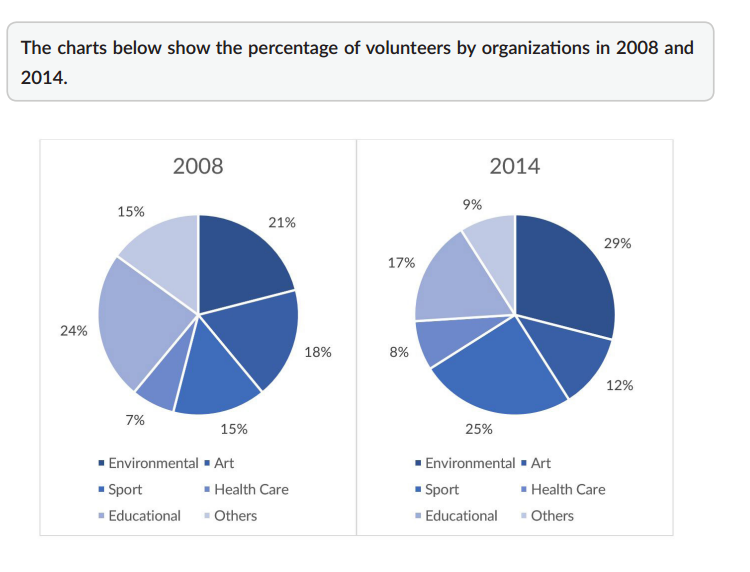
The given pie charts illustrate changes in the proportion of volunteers in six types of organization in 2008 and 2014.
It is clear that while the percentage of people who volunteered in environmental, sport, and health care organizations rose considerably from 2008 to 2014, the opposite was true for other types of organizations. Additionally, the proportion of volunteer participants in health care was by far the lowest in both years.
In 2008, volunteers in environmental projects accounted for 21%, three times that figure for health care, which was only 7 %. Over the next few years, in 2014, these figures witnessed marginal increases of 8% and 15% respectively. Likewise, starting at only 15% in 2008, the percentage of volunteer participants in sport rose almost double and made up for 25% in 2014.
At the same time, the proportion of volunteers in art and educational organizations experienced considerable decreases of 6% and 7% respectively. Also, there was a significant drop in that figure for other types of organizations to only 9% in 2014.

6typesoforganizat.png

