kngocph
Sep 9, 2020
Writing Feedback / Ielts task 1: Line graph - Oil consumption of four main consumers [2]
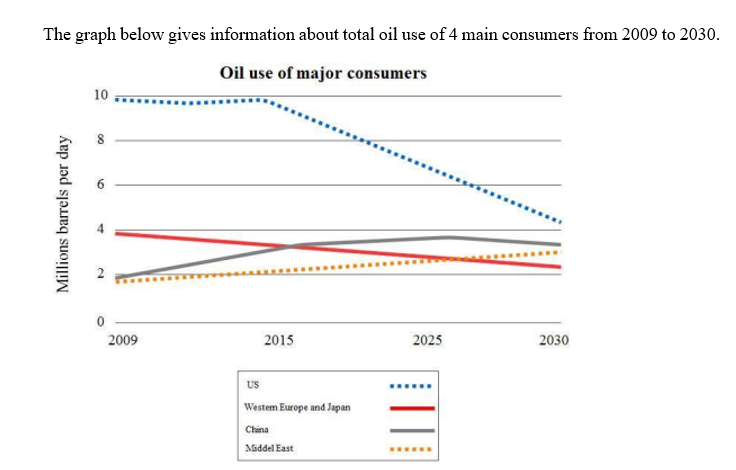
As can be seen from the graph, Middle East and China are predicted to increase, while there will be an expected decrease in oil consumed by US and Western Europe/ Japan in 2030. The US will always remain a major consumer over the 20-year period.
In 2009, US citizens consumed 10 million barrels per day, more than five times the figures for China and Middle East. Started at 4 million barrels, Western Europe and Japan experienced a gradual fall to 3 barrels in 2015. While total oil consumption in China and Middle East rose slightly, that of US remained constant till 2015.
By 2030, the number of oil consumed in China and Middle East, despite some fluctuations, are expected to rise to 3 million barrels each. By contrast, Western and Japan will witness a gradual decrease to 2 million in total oil consumption. The most significant change is the expected figure for oil consumed in US, with a sharp fall from 10 million to more than 4 million in 2015 and 2030, respectively.
Thank you for helping me to review my writing! What score can I get from this essay?
The line graph illustrates the total oil consumption of four different countries between 2009 and 2030.
As can be seen from the graph, Middle East and China are predicted to increase, while there will be an expected decrease in oil consumed by US and Western Europe/ Japan in 2030. The US will always remain a major consumer over the 20-year period.
In 2009, US citizens consumed 10 million barrels per day, more than five times the figures for China and Middle East. Started at 4 million barrels, Western Europe and Japan experienced a gradual fall to 3 barrels in 2015. While total oil consumption in China and Middle East rose slightly, that of US remained constant till 2015.
By 2030, the number of oil consumed in China and Middle East, despite some fluctuations, are expected to rise to 3 million barrels each. By contrast, Western and Japan will witness a gradual decrease to 2 million in total oil consumption. The most significant change is the expected figure for oil consumed in US, with a sharp fall from 10 million to more than 4 million in 2015 and 2030, respectively.
Thank you for helping me to review my writing! What score can I get from this essay?

Capture.PNG