Writing Feedback /
IELTS TASK 1 - The diagram illustrate immigration into the United States from 1850 to 1930 [4]
information about immigration to the United States
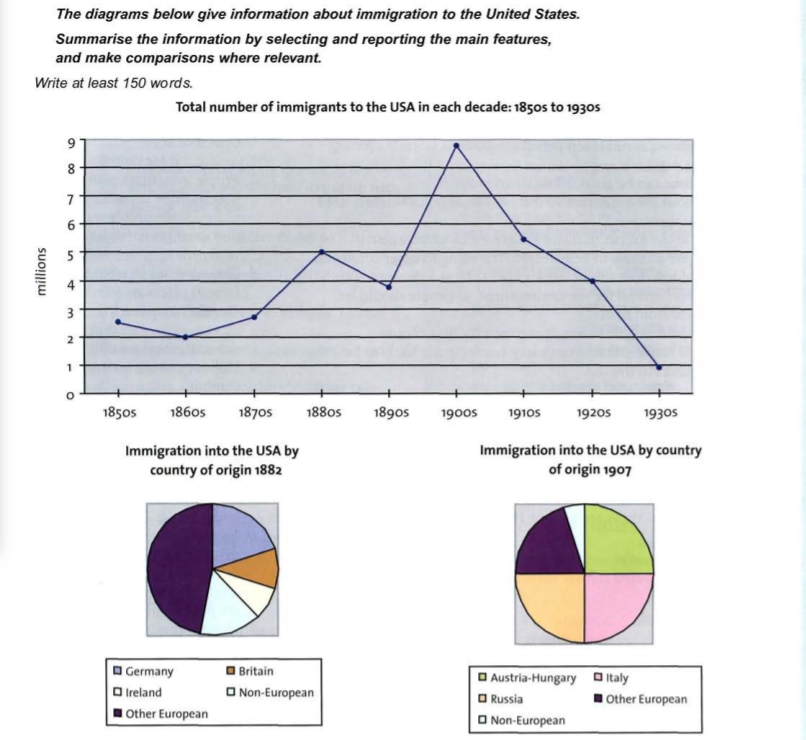
The data illustrate that migration to the United State from 1850 to 1930.
First of all, there was a fluctuate from 1850 to 1870, and then increase dramatically from 1870 to 1880 and from 1890 to 1990. What is more it reached a peak in 1990.
Secondly, it declined steadily from 1880 to 1890 and from 1910 to 1920. Furthermore, it decreased sharply from 1900 to 1910 and from 1920 to 1930.
Thirdly, in 1882 Other European were the largest country to immigrate into the USA, and then Non-European were the smallest part of immigration into the USA. In addition Germany and Ireland were almost in the same proportion.
Finally, in 1907 Austria-Hungary, Italy and Russia were three proportions in the same percentage. In fact there were the majority of immigration to the USA. In addition, Other European were in the forth which immigrated to the USA fell drastically. Last, Non-European remained the smallest one.

T1.jpg

