Trang Tran
Oct 7, 2020
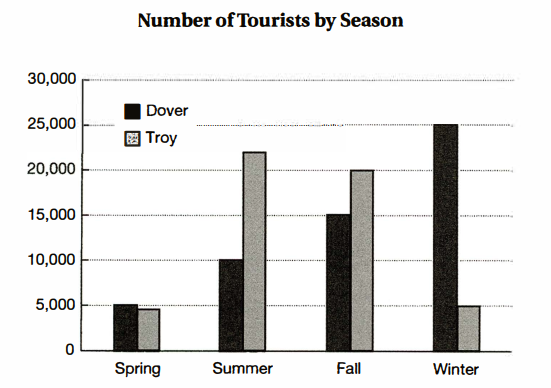
Writing Feedback / The Bar graph shows the number of tourists visiting two different cities by seasons [2]
There was a fluctuation in the number of tourists visiting Troy in four seasons. Under 5000 tourists in spring was the lowest number. Then there was a considerably increase of tourists in summer and it peaked at 22.000 at that time. The last two seasons of the years were the time this number decreased to 5000 in the winter.
On the other hand, people spent time visiting Dover most in winter. Spring was the time in which people visited Dover least and this number reached the bottom at 5000. The next two seasons witnessed the sharp increase in the number of tourists from 5000 to 15000 in the fall. After that, this number rose again and peaked at 25000 in winter.
tourists in dover and troy
There was a fluctuation in the number of tourists visiting Troy in four seasons. Under 5000 tourists in spring was the lowest number. Then there was a considerably increase of tourists in summer and it peaked at 22.000 at that time. The last two seasons of the years were the time this number decreased to 5000 in the winter.
On the other hand, people spent time visiting Dover most in winter. Spring was the time in which people visited Dover least and this number reached the bottom at 5000. The next two seasons witnessed the sharp increase in the number of tourists from 5000 to 15000 in the fall. After that, this number rose again and peaked at 25000 in winter.

Capture.PNG
