bwibimbap
Oct 18, 2020
Writing Feedback / The percentage of people working in different sectors in town A and B [3]
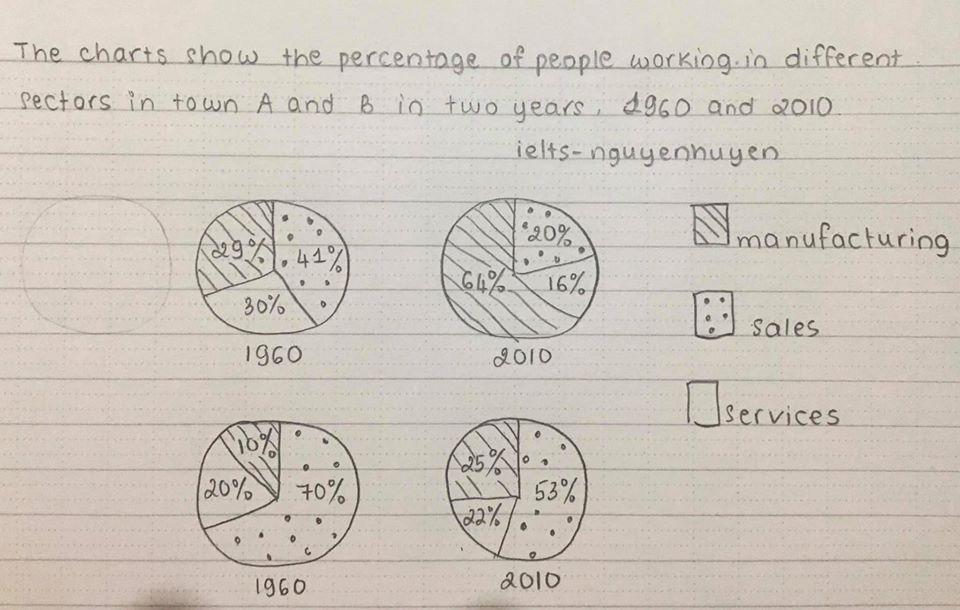
The graphs illustrate how the proportion of people worked for three distinct sectors in town A and B changed after a 50-year period from 1960.
Overall, the majority of workers in town B were employed to perform sales-related jobs in both 1960 and 2010. While this was true for town A in 1960, this town had manufacturing as the biggest employer in 2010.
In 1960, sales attracted the most employees in both town A and B with the figures of 41% and 72% respectively. The rate of people worked in services in town A was almost one third of the total rate at 30%, 10% higher than that in town B. Town B had the modest proportion of workers for manufacturing with 8%, while that of town A was over three times higher, at 29%.
In 2010, the rate of manufacturing workers in town A accounted for the majority of the total rate, at 64%. By contrast, the equivalent figure for town B was only 24% and sales was the hugest employer with the statistic of 54%. The figures for the services sector in town A and B were 16% and 22% respectively.
the rate of workers in two towns
The graphs illustrate how the proportion of people worked for three distinct sectors in town A and B changed after a 50-year period from 1960.
Overall, the majority of workers in town B were employed to perform sales-related jobs in both 1960 and 2010. While this was true for town A in 1960, this town had manufacturing as the biggest employer in 2010.
In 1960, sales attracted the most employees in both town A and B with the figures of 41% and 72% respectively. The rate of people worked in services in town A was almost one third of the total rate at 30%, 10% higher than that in town B. Town B had the modest proportion of workers for manufacturing with 8%, while that of town A was over three times higher, at 29%.
In 2010, the rate of manufacturing workers in town A accounted for the majority of the total rate, at 64%. By contrast, the equivalent figure for town B was only 24% and sales was the hugest employer with the statistic of 54%. The figures for the services sector in town A and B were 16% and 22% respectively.

dethiieltswriting.jpg
